Blob detection AI 2026 in trading
The intersection of computer vision and financial markets is shifting from experimental to operational. In 2026, the primary mechanism driving this shift is the application of YOLO26 (You Only Look Once) models to market data. Originally designed for real-time object detection in video feeds, YOLO26’s ability to identify and classify visual patterns with high speed and precision is now being repurposed for volatility trading. This convergence treats market charts not as abstract numbers, but as visual landscapes where patterns repeat and evolve.
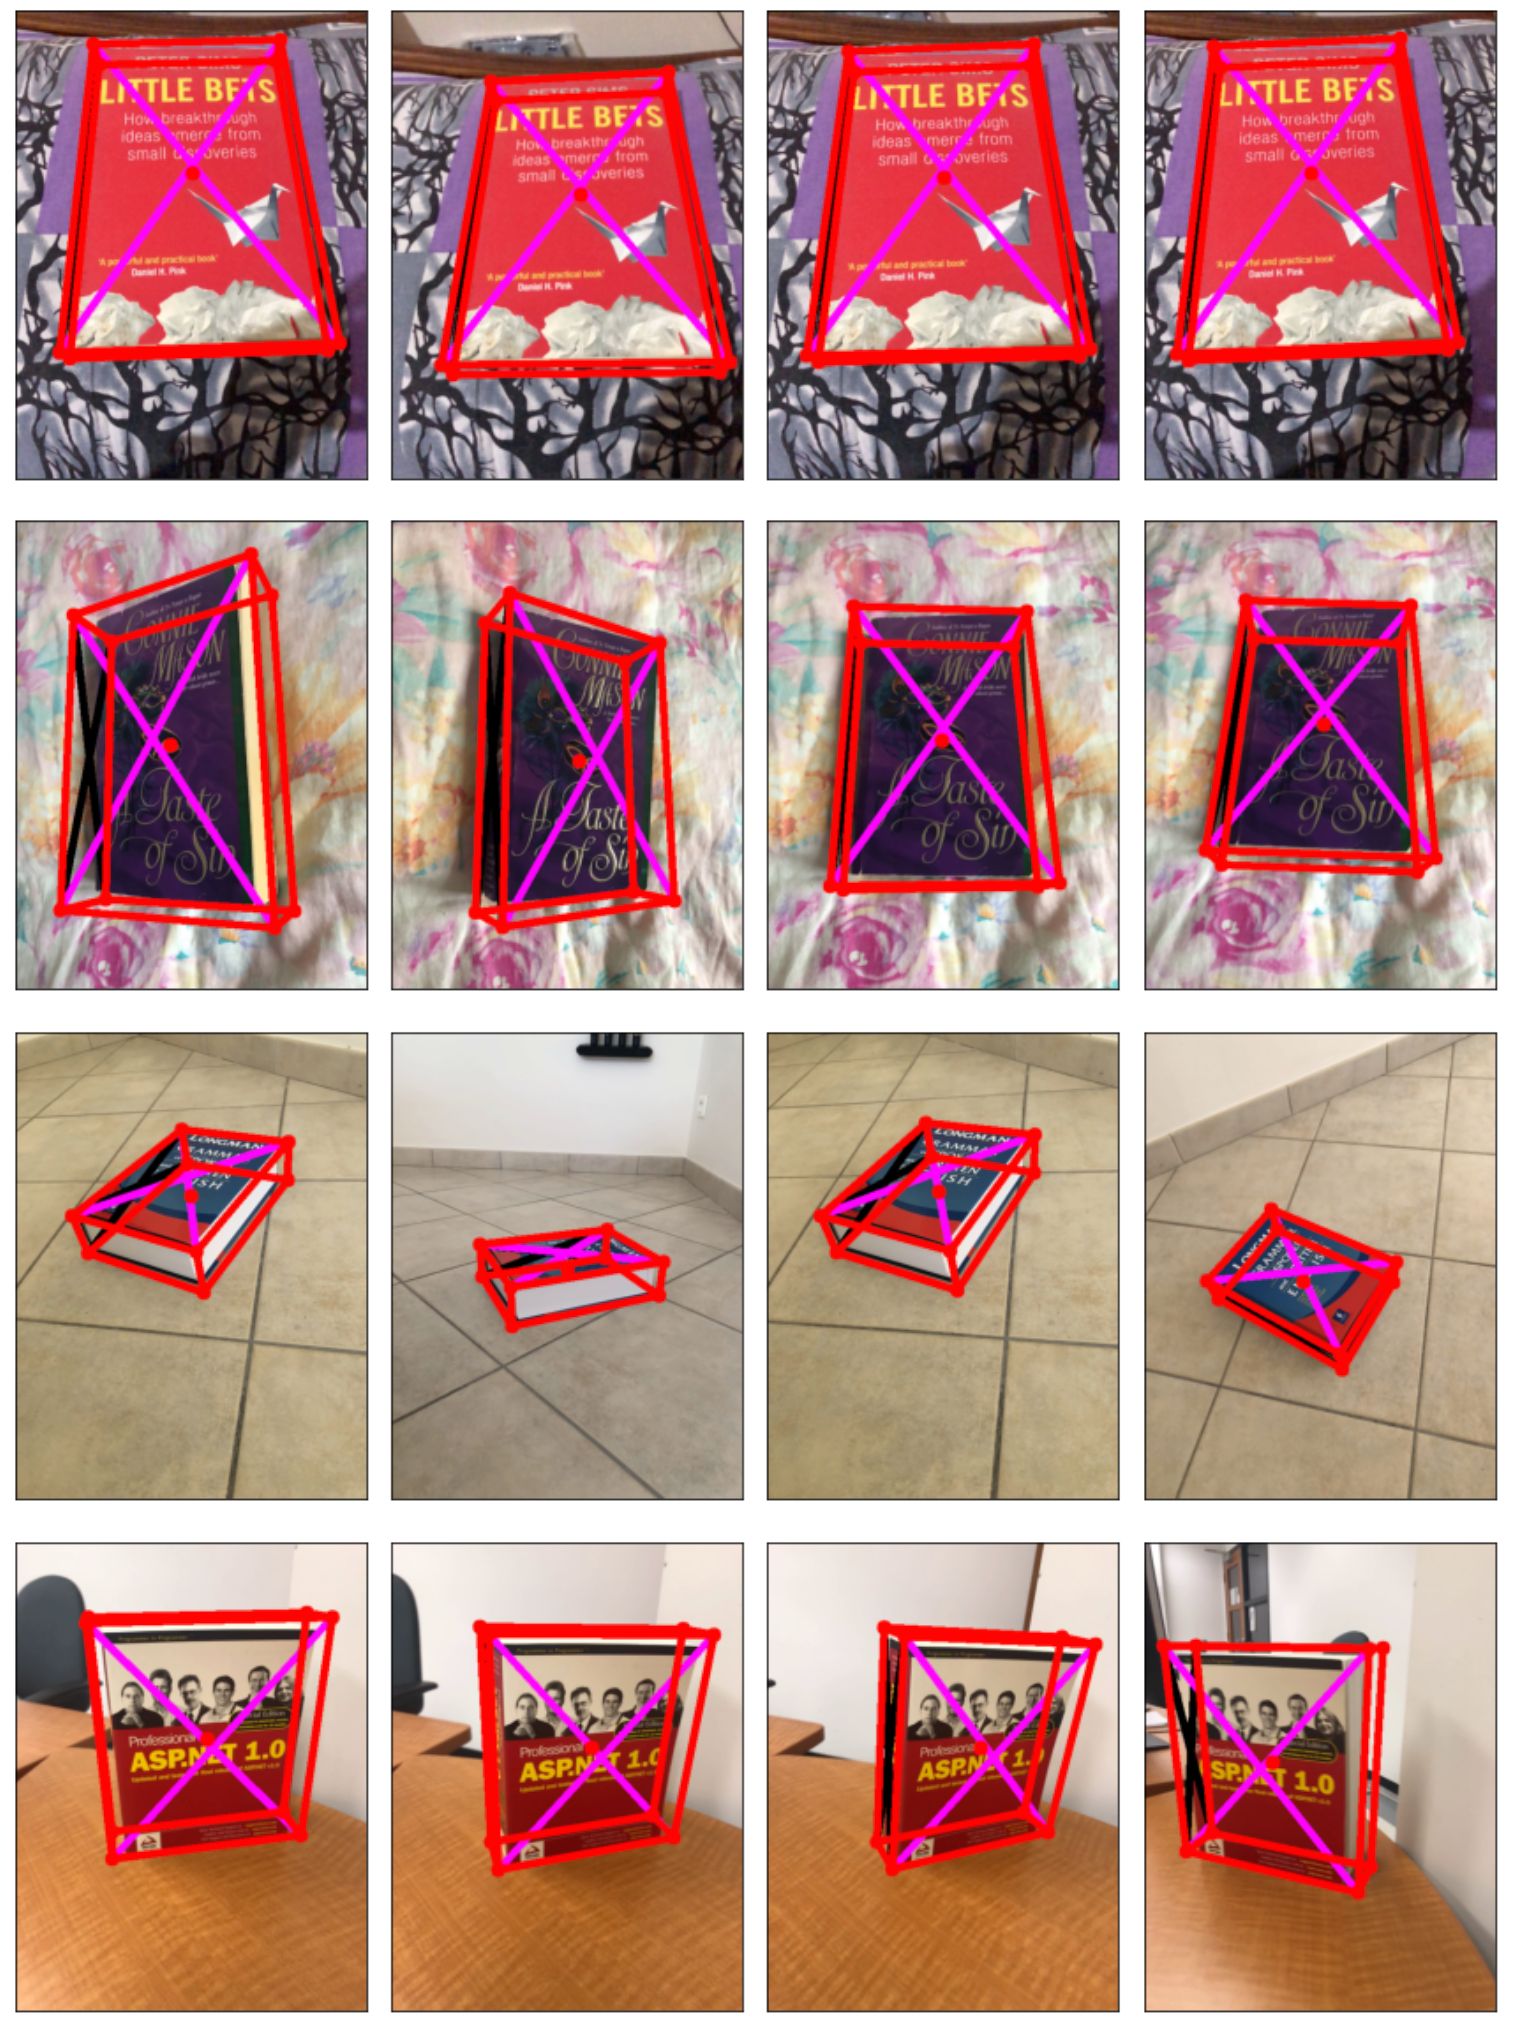
YOLO26 represents a multi-task model family capable of handling object detection, instance segmentation, and pose estimation simultaneously. This versatility allows traders to extract multiple layers of information from a single chart image. Instead of relying solely on traditional technical indicators like moving averages, algorithms can now detect structural formations—such as head-and-shoulders patterns or support/resistance breaks—directly from the visual representation of price action. The model’s speed enables real-time analysis, a critical factor in volatile markets where milliseconds determine alpha.
This visual pattern recognition is becoming a primary source of alpha because it captures nuances that numerical data often misses. Human traders have long relied on chart reading to gauge market sentiment and potential reversals. By automating this process with YOLO26, trading systems can process vast amounts of visual data without fatigue or bias. The result is a more robust framework for identifying volatility spikes and trend changes, leveraging the same technology that powers autonomous vehicles and industrial inspection systems to navigate financial uncertainty.
YOLO26 and real-time vision
The architecture behind modern blob detection AI has shifted from static classification to dynamic, multi-task vision models. Ultralytics introduced YOLO26 as a family of models designed to handle object detection, instance segmentation, and pose estimation within a single unified pipeline. This consolidation allows traders to process complex market data streams with lower latency than previous generations.
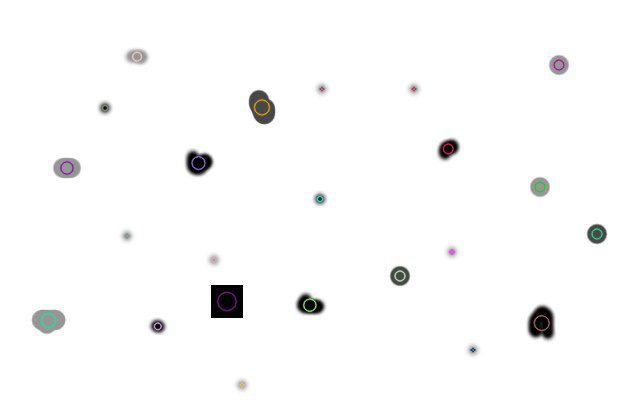
In volatility trading, a "blob" represents a cluster of anomalous order flow or liquidity gaps. Traditional tools often lag, processing data after the price has already moved. YOLO26’s real-time inference capabilities enable the detection of these visual patterns in order book heatmaps and footprint charts as they form. By treating market microstructure as a visual field, the model identifies structural breaks faster than rule-based algorithms.
The model’s ability to run multi-task inference means it can simultaneously detect trend direction, volume anomalies, and support/resistance breaks. This reduces the computational overhead of running separate models for each task, a critical advantage in high-frequency environments where milliseconds determine profitability.
For traders, this means the visual signature of a market anomaly—such as a sudden liquidity void or a spoofing pattern—can be flagged instantly. The model does not just see price; it sees the structure of the trade. This shift from numerical analysis to visual pattern recognition is becoming the standard for detecting volatility before it becomes a trend.
For the latest technical specifications and benchmarking data on YOLO26’s performance, refer to the official Ultralytics documentation.
Top algorithmic trading tools
Running blob detection models on market data requires more than just code; it demands the right software stack and hardware backbone. Traders who rely on visual pattern recognition—treating volatility clusters as "blobs" on a chart—need tools that can process these signals in real time without latency. The following tools represent the current standard for deploying blob detection in a trading environment.
YOLO26 for Real-Time Pattern Recognition
YOLO26 (You Only Look Once) remains the industry benchmark for real-time object detection. In the context of blob detection, it excels at identifying distinct volatility clusters or volume anomalies on chart overlays. Ultralytics, the team behind YOLO, released version 26 with multi-task capabilities, allowing traders to run detection, segmentation, and pose estimation simultaneously. This is critical when you need to isolate specific market structures from noisy background data.
The model’s speed allows for near-instantaneous feedback, which is non-negotiable in high-frequency environments. While YOLO is primarily a computer vision tool, its architecture can be adapted to treat technical indicators as visual inputs, enabling traders to "see" patterns that traditional numerical algorithms might miss. For detailed implementation guides, the official Ultralytics documentation provides the necessary technical depth.
Panoptican for Visual Analytics
Panoptican offers a different approach by focusing on the visual transformation of data. Rather than just detecting blobs, it allows traders to create high-tech visualizations that sync visual effects to market movements. This tool is particularly useful for retail traders and analysts who prefer a more intuitive, visual interface over raw code.
By turning market data into dynamic visual blobs, Panoptican helps users identify trends and reversals through color and motion. It is less about raw speed and more about interpretability. If your trading strategy relies on recognizing complex, multi-dimensional patterns that are hard to quantify numerically, Panoptican’s visual-first approach can provide the clarity needed to make faster decisions.
Roboflow for Data Pipeline Management
Even the best detection model is useless without clean, labeled data. Roboflow provides the infrastructure to manage the entire computer vision pipeline, from data collection to model deployment. For traders, this means you can curate historical chart data, label volatility blobs, and train custom models tailored to specific assets like crypto or forex.
Roboflow’s platform simplifies the process of preparing training data, which is often the most time-consuming part of building a custom blob detection system. It supports integration with popular frameworks, ensuring that your trained models can be deployed seamlessly into your existing trading infrastructure. This end-to-end management is essential for maintaining a competitive edge in algorithmic trading.

Hardware for Edge AI Deployment
Running these models locally requires significant computational power, especially if you are processing live video feeds or high-frequency chart data. Edge AI devices allow you to run inference locally, reducing latency and ensuring your data never leaves your control.


As an Amazon Associate, we may earn from qualifying purchases.
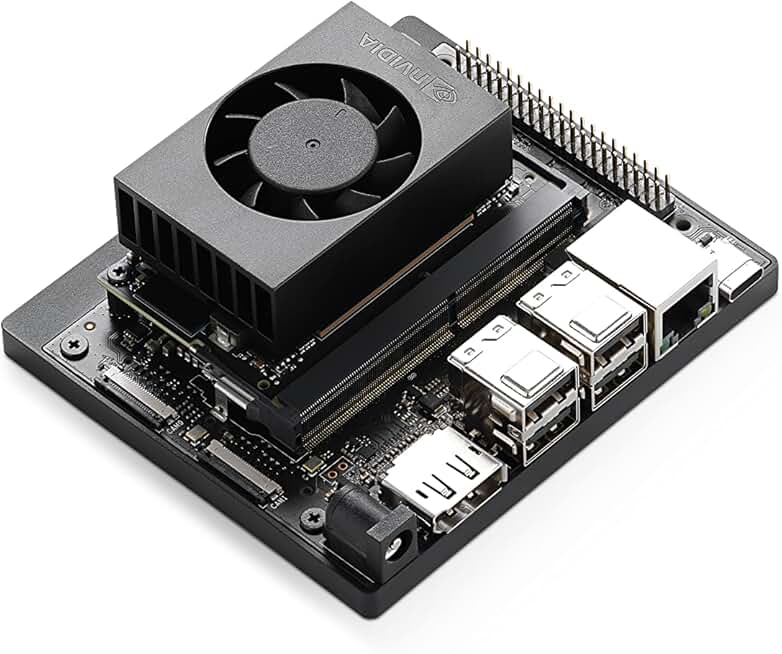
For traders running local blob detection models, investing in robust hardware is as important as the software itself. The NVIDIA Jetson Orin Nano is a popular choice for edge devices due to its balance of power and size. For desktop setups, high-end GPUs like the RTX 4090 provide the necessary VRAM to handle large, complex models. Fast SSDs are also critical for quickly loading and processing large historical datasets.
Comparison of Key Tools
Choosing the right tool depends on your specific needs. YOLO26 is best for speed and accuracy, Panoptican for visual clarity, and Roboflow for data management.
| Tool | Primary Use | Best For |
|---|---|---|
| YOLO26 | Real-time detection | Speed and accuracy |
| Panoptican | Visual analytics | Interpretability |
| Roboflow | Data pipeline | Data preparation |
Deploy blob detection for volatility trading
Integrating blob detection AI into a trading strategy requires moving from raw visual data to executable signals. The workflow hinges on ingesting market visuals, processing them with lightweight models, and executing trades based on detected anomalies. This approach treats market volatility as a spatial pattern, allowing algorithms to react to structural breaks faster than traditional time-series analysis.
Feed live chart data or order book heatmaps into the pipeline. Use WebSocket connections to stream candlestick patterns or volatility surfaces. The system must normalize these inputs into tensor formats suitable for computer vision models, ensuring consistent scaling across different assets and timeframes.
Deploy optimized models like YOLOv8 Lite or EfficientNet-Lite for rapid detection. These architectures balance speed and accuracy, critical for catching fleeting volatility spikes. Run inference on GPU-accelerated servers or edge devices to minimize latency between detection and decision-making.
Not every detected blob represents a tradeable opportunity. Apply filters to remove noise, such as low-confidence detections or patterns occurring during low-volume periods. Cross-reference visual signals with traditional indicators like RSI or volume spikes to confirm the validity of the volatility event.

Connect the signal engine to your broker’s API. When a high-confidence volatility blob is detected and validated, trigger pre-defined order types. Use limit orders for precision or market orders for immediate entry, depending on the asset’s liquidity and the speed of the detected move.
Markets evolve, and so do volatility patterns. Continuously monitor the performance of your detection models. Retrain them on new data to adapt to changing market regimes. Use feedback loops from past trades to refine the model’s sensitivity to specific types of volatility blobs.

No comments yet. Be the first to share your thoughts!