Celestia’s modular blockchain architecture has propelled data blobs into the forefront of on-chain markets. As of October 2025, the average daily blob size on Celestia has surged to 11.4 GB, driven by NFT minting and new protocols leveraging Celestia for data availability. With the TIA token trading at $0.9910, and blobspace demand at all-time highs, understanding how to analyze Celestia blob pricing trends is now a core competency for traders, developers, and data-driven investors.
Why Blob Pricing Trends Matter in 2025
Blob pricing directly impacts every project building on Celestia. Transaction fees, cost optimization, and market entry timing all hinge on real-time blobspace analytics. With TIA fees reflecting both network congestion and underlying token volatility, traders who can accurately interpret blob market signals gain a decisive edge. The following tools and strategies form the backbone of any serious blobspace trading operation:
Top 6 Tools & Strategies for Celestia Blob Pricing Analysis
- Blobspace Markets Real-Time Analytics Dashboard: This dashboard delivers live metrics on blobspace usage, median blob costs, and top namespaces, empowering traders to monitor Celestia's pricing dynamics and optimize transaction timing.
- On-chain Blob Transaction Volume Analysis via Celestia Explorer: Use the Celestia Explorer to track on-chain blob transaction volumes, fee patterns, and network activity, providing granular data for trend identification and market movement forecasting.
- Technical Charting with TradingView (TIAUSD) for Blob-Related Price Correlations: Leverage TradingView’s TIAUSD charts to analyze price movements, technical indicators, and correlations between TIA price ($0.9910) and blob pricing trends.
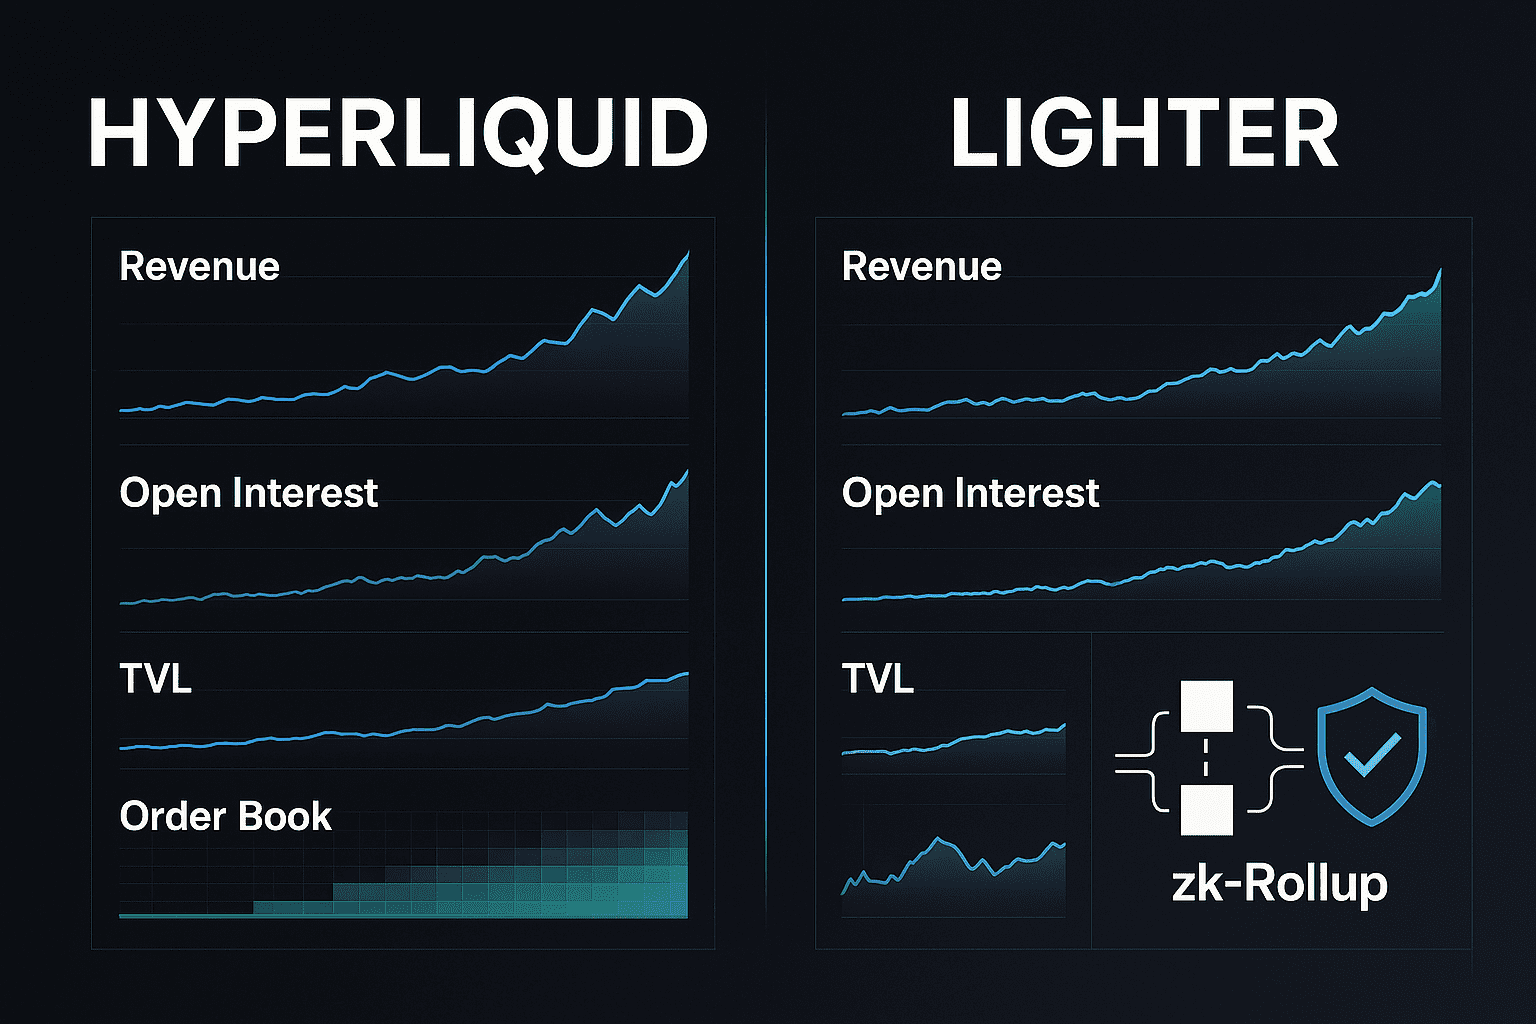
- Order Book Depth and Liquidity Monitoring on Celestia-based CLOB DEXs: Monitor order book depth and liquidity on Celestia-based Central Limit Order Book (CLOB) DEXs to assess market efficiency, slippage risk, and trading opportunities for blob-related assets.
- Historical Blob Pricing Data Backtesting Using Python or R Scripts: Employ Python or R to backtest historical blob pricing data, enabling traders to validate strategies and model potential outcomes based on past market behavior.
- Market Sentiment Tracking from Social Channels and Developer Forums: Analyze sentiment trends across Twitter, Discord, and developer forums to gauge market mood and anticipate shifts in blob pricing driven by community and developer activity.
1. Blobspace Markets Real-Time Analytics Dashboard
The Blobspace Markets Real-Time Analytics Dashboard is the primary interface for monitoring blob pricing, network throughput, and fee volatility. This dashboard aggregates on-chain data to display:
- Median and mean blob costs (in TIA and USD)
- Blobspace utilization rates and block-level congestion
- Fee spikes correlated with NFT mints or Layer 2 rollup activity
- Top namespaces and trending data types
By setting custom alerts for fee thresholds or blob usage surges, traders can react to market events in real time, optimizing submission timing. For a practical guide to using these analytics, see How to Analyze Celestia Data Blob Pricing Trends on Blobspace Markets.
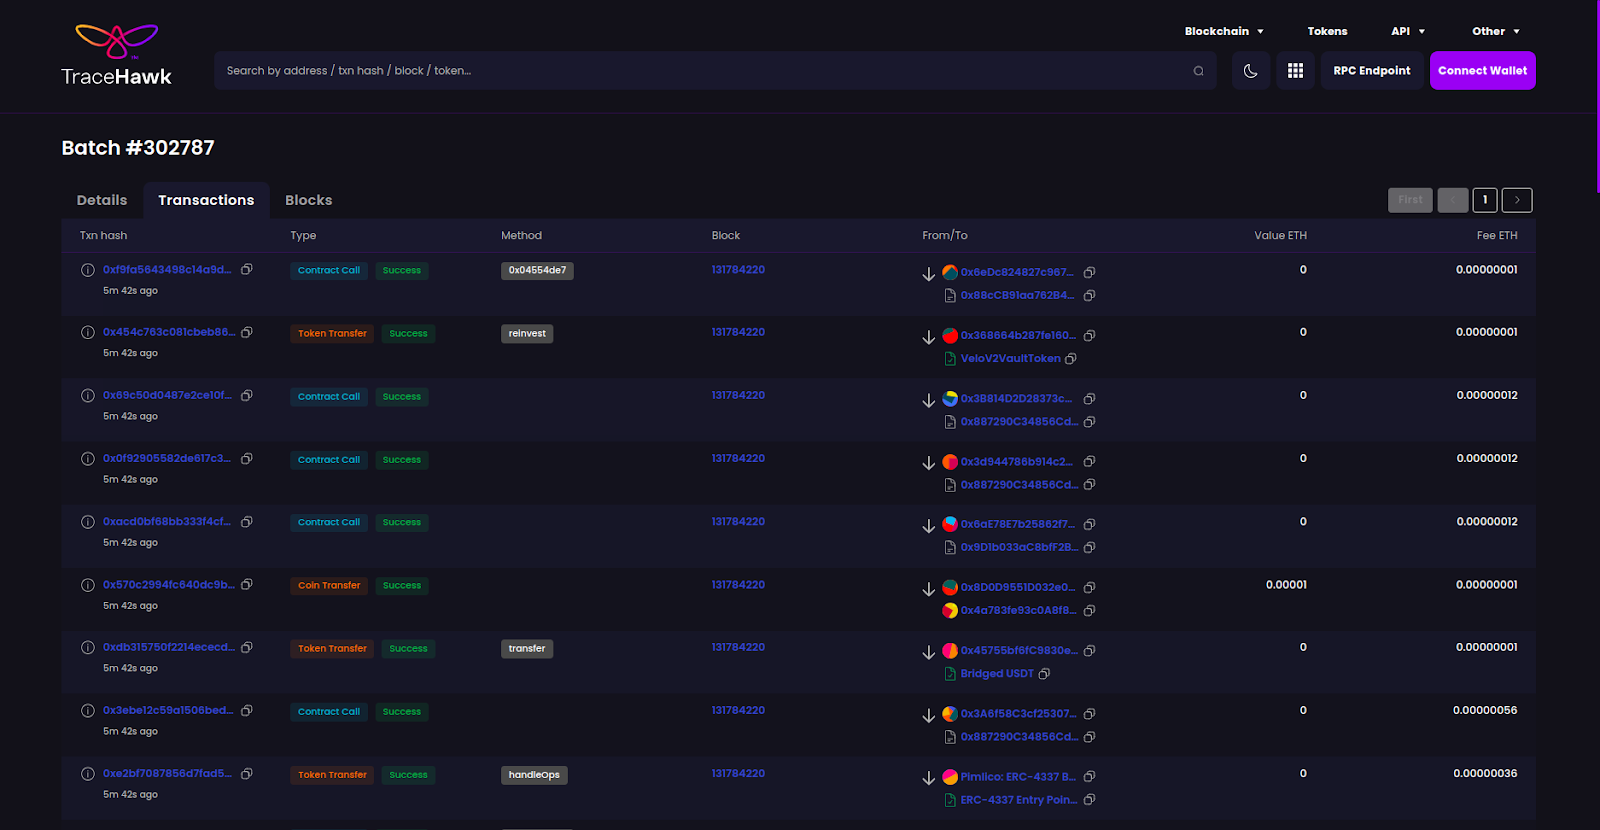
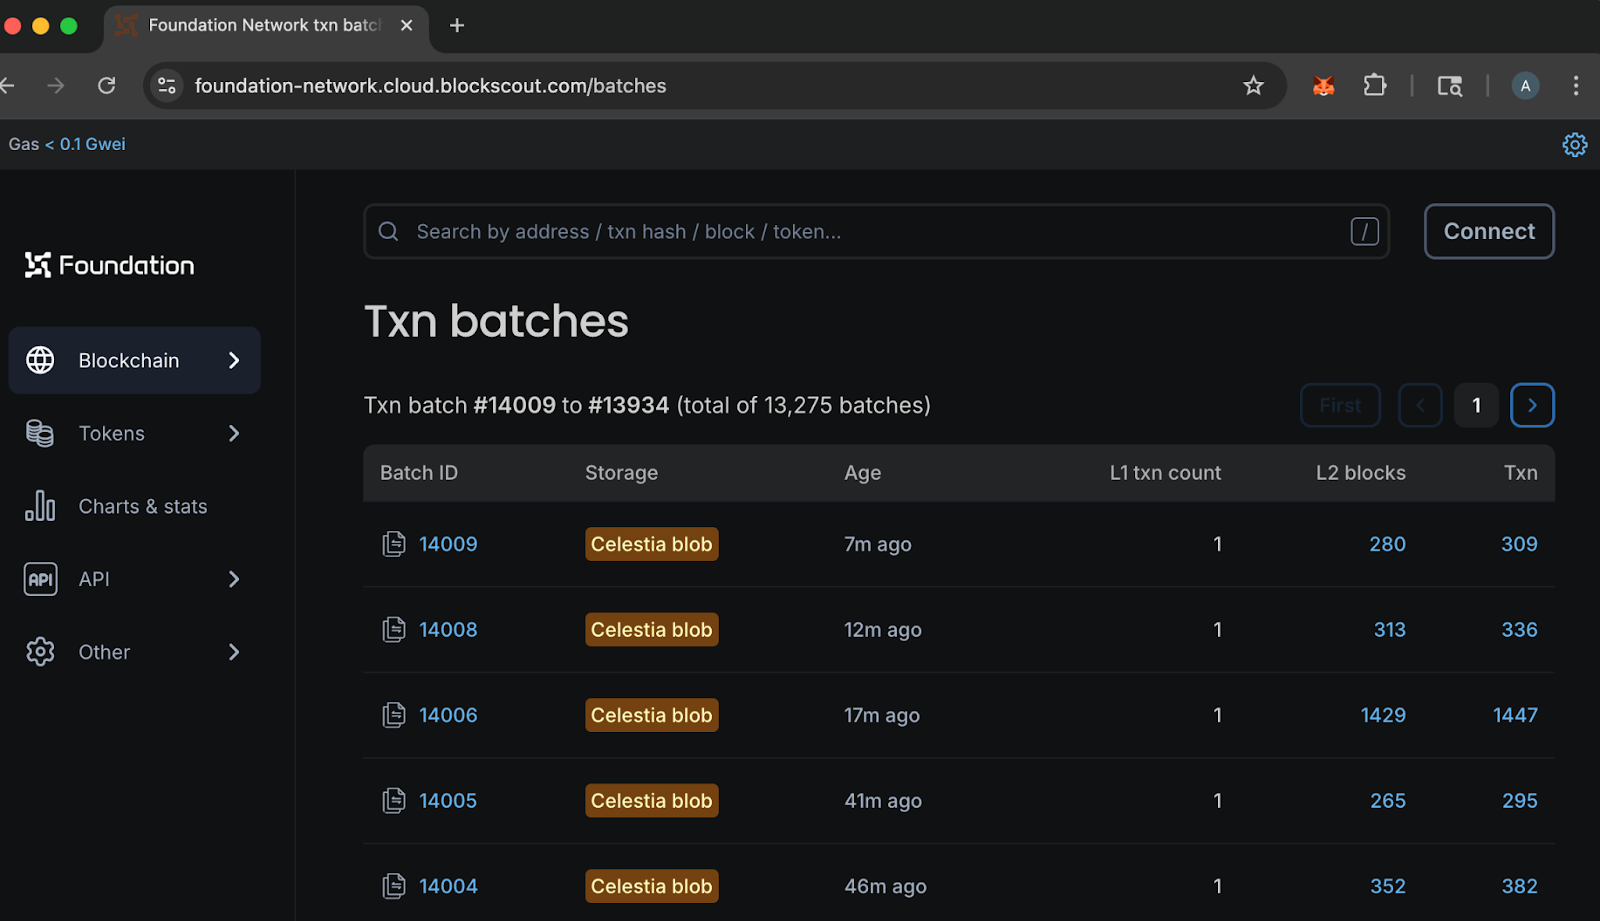
2. On-chain Blob Transaction Volume Analysis via Celestia Explorer
Raw transaction volume is a leading indicator of blob market health. Using Celestia Explorer, traders can:
- Track daily, weekly, and monthly blob counts
- Analyze which addresses and namespaces are most active
- Identify patterns in large-scale data batching or compression strategies
High transaction volumes often precede fee surges, especially when associated with major NFT drops or protocol launches. Monitoring these trends helps traders anticipate volatility and adjust their strategies accordingly.
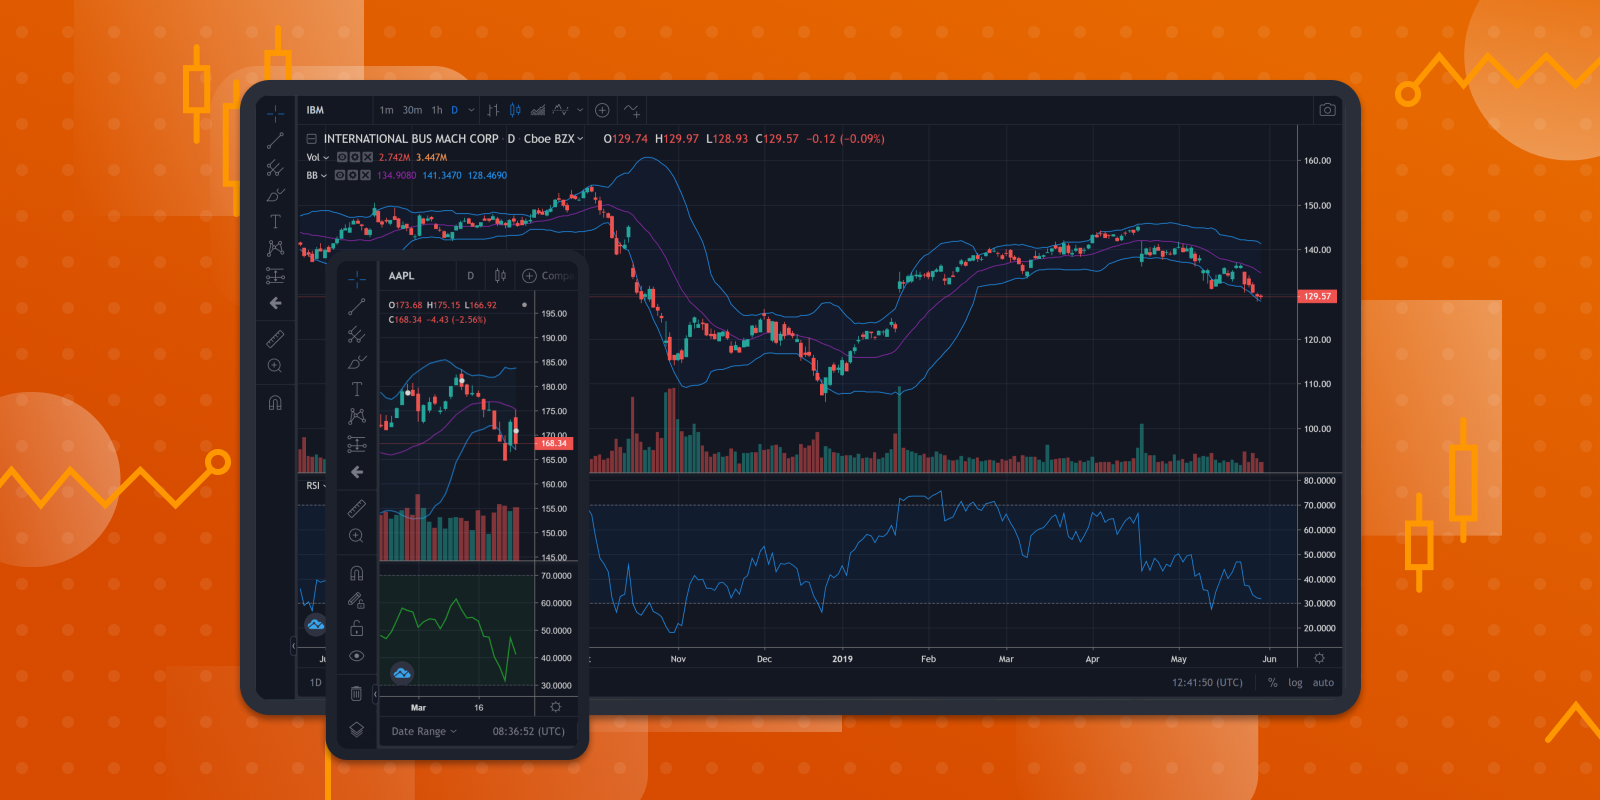
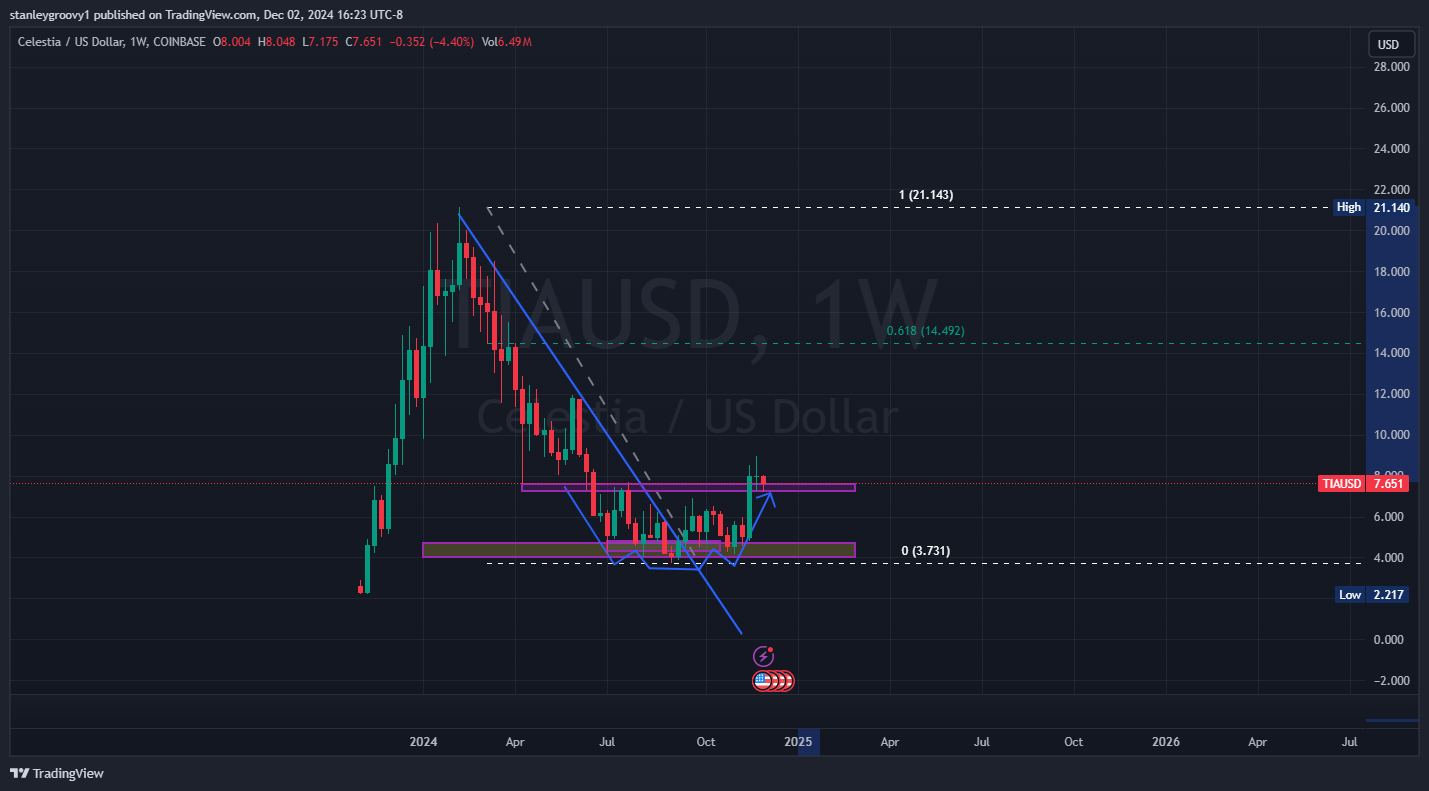
3. Technical Charting with TradingView (TIAUSD) for Blob-Related Price Correlations
Blob pricing is tightly linked to TIA/USD price action. Advanced traders deploy TradingView’s TIAUSD charts to overlay blob fee data with:
- Moving averages and oscillators (RSI, MACD) to spot momentum shifts
- Support/resistance levels corresponding to historical fee spikes
- Correlation studies between TIA price swings and blob submission costs
For instance, a rally in TIA price can instantly translate to higher USD-denominated blob fees, impacting project economics and arbitrage opportunities. Technical charting enables traders to quantify these relationships and time their data submissions for optimal cost efficiency.
Celestia Technical Analysis Chart
Analysis by Ivy Sanderson | Symbol: BINANCE:TIAUSDT | Interval: 1h | Drawings: 8
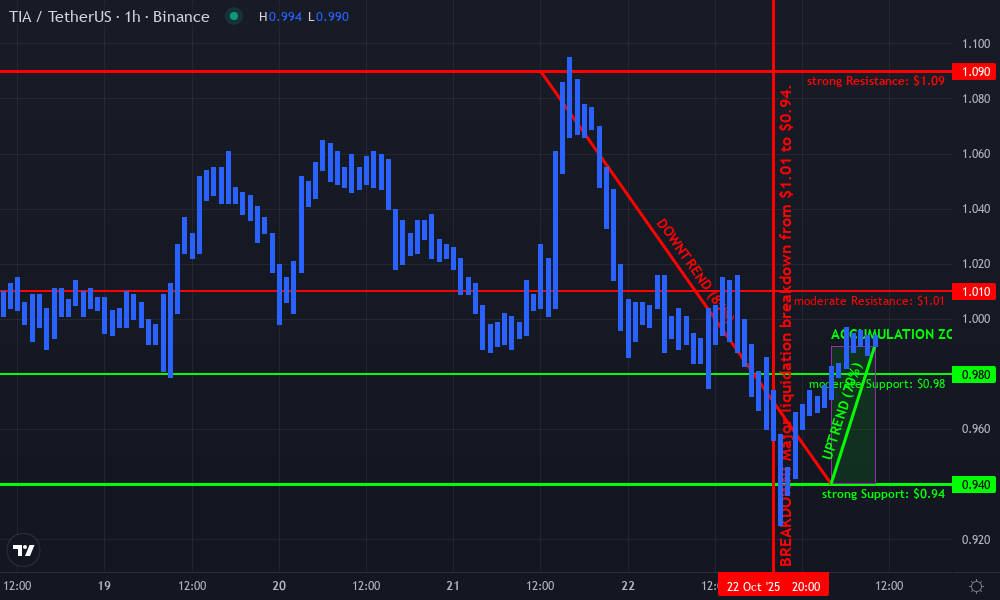
Technical Analysis Summary
On this hourly TIA/USDT chart, draw aggressive trend lines to capture the recent high-volatility swings. Mark the sharp downtrend from the $1.09 peak (around 2025-10-21 12:00) to the $0.94 low (2025-10-23 04:00) as the dominant move. Overlay horizontal lines at $0.94 (recent extreme low), $0.98 (current price cluster/support), $1.01 (local resistance), and $1.09 (recent high). Use a rectangle to highlight the accumulation zone between $0.94 and $0.99 during the 2025-10-23 recovery. Annotate with callouts/arrow markers for the failed retests at $1.01 and the V-shape recovery from $0.94. If MACD/volume were visible, place up/down arrows where they would confirm reversals. Mark an aggressive entry near $0.98 with a tight stop below $0.94, aiming for an exit near $1.01. Highlight the breakdown event (2025-10-22 to 2025-10-23) with a vertical line.
Risk Assessment: high
Analysis: Current price action is extremely volatile with sharp reversals; reward potential is high but so is drawdown risk. Only suitable for experienced, risk-tolerant traders.
Ivy Sanderson's Recommendation: Lean into the volatility with tight stops. Buy the $0.98 zone, stop below $0.94, and target $1.01+. Be prepared to reverse fast if the breakdown resumes—capital preservation always comes first.
Key Support & Resistance Levels
📈 Support Levels:
- $0.94 - Recent flash crash low, likely to attract aggressive buyers if retested. strong
- $0.98 - Current price region; acted as a former resistance and now pivoted to support. moderate
📉 Resistance Levels:
- $1.01 - Ceiling for recent bounces; multiple failed retests. moderate
- $1.09 - Swing high; breakout level if momentum returns. strong
Trading Zones (high risk tolerance)
🎯 Entry Zones:
- $0.98 - Aggressive rebound entry in the recovery leg off $0.94 extreme. high risk
🚪 Exit Zones:
- $1.01 - First resistance target for profit-taking. 💰 profit target
- $0.94 - Stop loss below recent panic low. 🛡️ stop loss
Technical Indicators Analysis
📊 Volume Analysis:
Pattern: Volume likely spiked on the breakdown to $0.94 and during the recovery, validating the V-shape reversal potential.
Aggressive volume surges suggest capitulation and reversal interest. Draw callouts or arrow markers at these inflection points.
📈 MACD Analysis:
Signal: MACD likely flipped bullish on the recovery from $0.94, but confirmation is needed on the next hourly close.
Look for bullish cross confirmation at the start of the uptrend; mark with an up arrow or callout.
Applied TradingView Drawing Utilities
This chart analysis utilizes the following professional drawing tools:
Disclaimer: This technical analysis by Ivy Sanderson is for educational purposes only and should not be considered as financial advice. Trading involves risk, and you should always do your own research before making investment decisions. Past performance does not guarantee future results. The analysis reflects the author's personal methodology and risk tolerance (high).
To explore more advanced techniques, see our detailed walkthrough: How to Analyze Celestia Blob Pricing Trends Using Blobspace Markets Tools.
4. Order Book Depth and Liquidity Monitoring on Celestia-based CLOB DEXs
The emergence of Celestia-based central limit order book (CLOB) DEXs has transformed blobspace liquidity. By monitoring order book depth, bid-ask spreads, and recent fills, traders can:
- Gauge market sentiment and spot liquidity voids
- Identify arbitrage between blobspace and TIA spot/futures markets
- Optimize order placement to minimize slippage during volatile periods
Institutional participants especially benefit from deep liquidity pools, but even retail traders can leverage live order book analytics to refine their execution strategies.
Celestia (TIA) Price Prediction and Blob Fee Trends: 2026–2031
Forecast based on current adoption, technical analysis, and ecosystem developments. All prices in USD per TIA.
| Year | Minimum Price | Average Price | Maximum Price | Year-on-Year % Change (Avg) | Market Scenario Insights |
|---|---|---|---|---|---|
| 2026 | $0.89 | $1.18 | $1.45 | +19% | Post-2025 consolidation; steady NFT and Layer 2 adoption drive gradual fee and price growth. |
| 2027 | $1.01 | $1.32 | $1.70 | +12% | Increased blobspace demand from new dApps; regulatory clarity boosts institutional interest. |
| 2028 | $1.19 | $1.58 | $2.06 | +20% | Major scaling upgrades; expanded use cases in DePIN and on-chain data markets. |
| 2029 | $1.44 | $1.85 | $2.45 | +17% | Market cycle peak; strong ecosystem, but volatility from broader crypto trends. |
| 2030 | $1.21 | $1.62 | $2.10 | -12% | Potential market correction; competition from rival DA solutions tempers growth. |
| 2031 | $1.35 | $1.80 | $2.38 | +11% | Renewed adoption, cross-chain integrations, and improved blob pricing efficiency. |
Price Prediction Summary
Celestia (TIA) is projected to experience steady price appreciation through 2029, fueled by growing demand for blobspace, adoption of modular blockchain solutions, and increasing developer activity. Some volatility is expected as the crypto market cycles, with a possible correction in 2030 before resuming upward momentum. Blob fee trends will follow TIA price movements, but may be mitigated by scaling improvements and transaction optimizations.
Key Factors Affecting Celestia Price
- Ecosystem growth (NFTs, DePIN, Layer 2 rollups) increasing blobspace demand
- Technical upgrades (compression, batching, scaling solutions) reducing per-blob fees
- Regulatory developments affecting institutional and developer participation
- Competition from alternative data availability layers or modular blockchains
- Overall crypto market cycles influencing speculative and fundamental value
- Adoption of Celestia’s analytics and fee optimization tools by traders and developers
Disclaimer: Cryptocurrency price predictions are speculative and based on current market analysis. Actual prices may vary significantly due to market volatility, regulatory changes, and other factors. Always do your own research before making investment decisions.
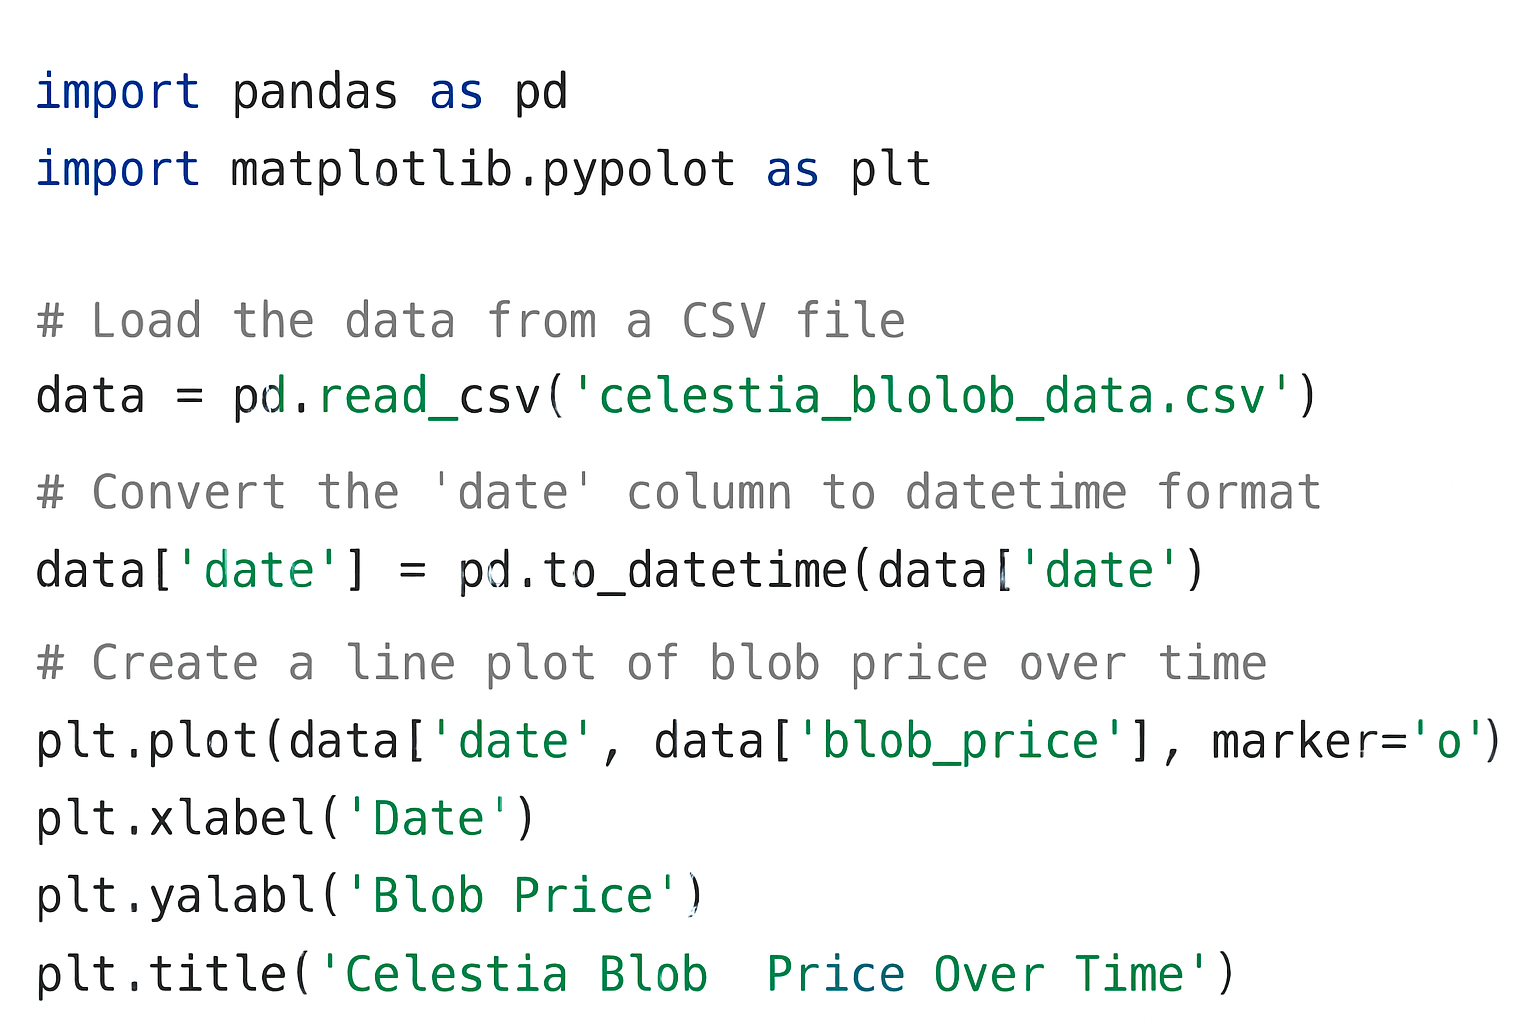
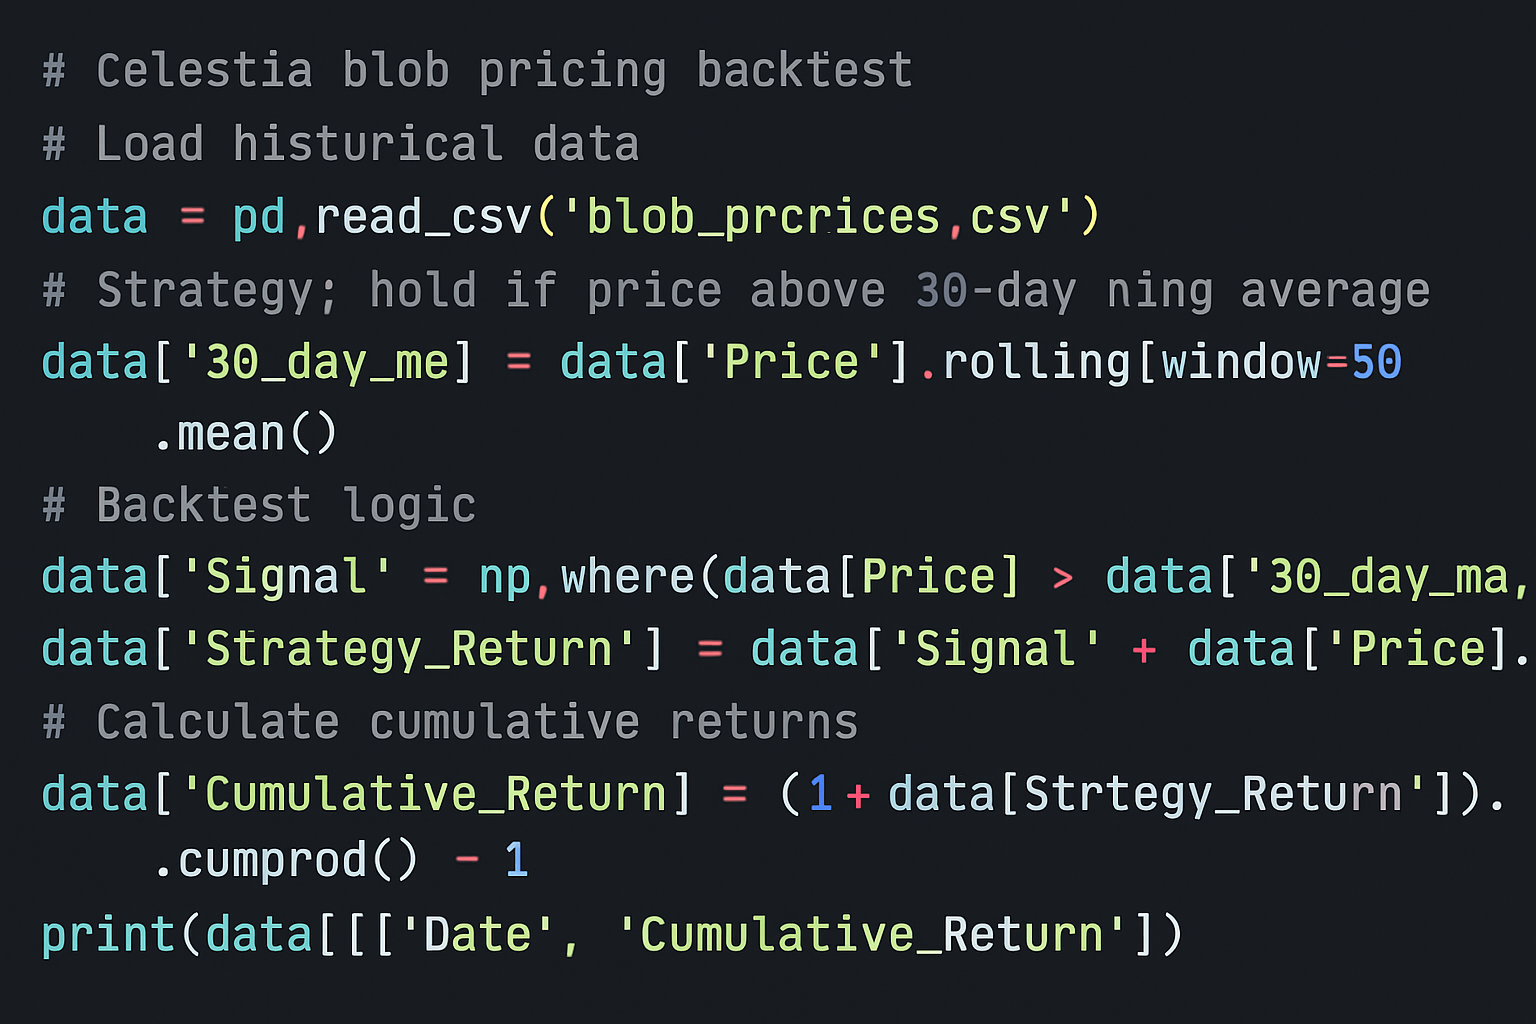
5. Historical Blob Pricing Data Backtesting Using Python or R Scripts
Backtesting is essential for validating trading hypotheses. By downloading historical blob pricing and fee data from Blobspace Markets, analysts can:
- Backtest cost-optimization strategies across different congestion regimes
- Model the impact of batch sizes, compression, and timing on realized fees
- Visualize long-term correlations between TIA price, network activity, and blob costs
Python and R scripts enable rigorous statistical analysis, helping traders separate signal from noise in a rapidly evolving market. For a step-by-step backtesting guide, refer to How to Analyze Celestia Data Blob Market Trends: A Guide for Blockchain Developers.
6. Market Sentiment Tracking from Social Channels and Developer Forums
Purely quantitative signals are only half the picture. Market sentiment - especially in emerging ecosystems like Celestia blobspace - can drive short-term fee spikes and trend reversals. Monitoring Discord servers, Twitter threads, and developer forums provides early insight into:
- Upcoming protocol launches or major NFT mints likely to congest blobspace
- Community reactions to fee changes, upgrades, or governance proposals
- Emerging narratives around blobspace utility and adoption
Sentiment analysis tools can automate this process, but hands-on participation in developer channels often yields actionable information before it’s reflected in on-chain data. Combining social intelligence with technical analytics is a proven edge for blob traders.
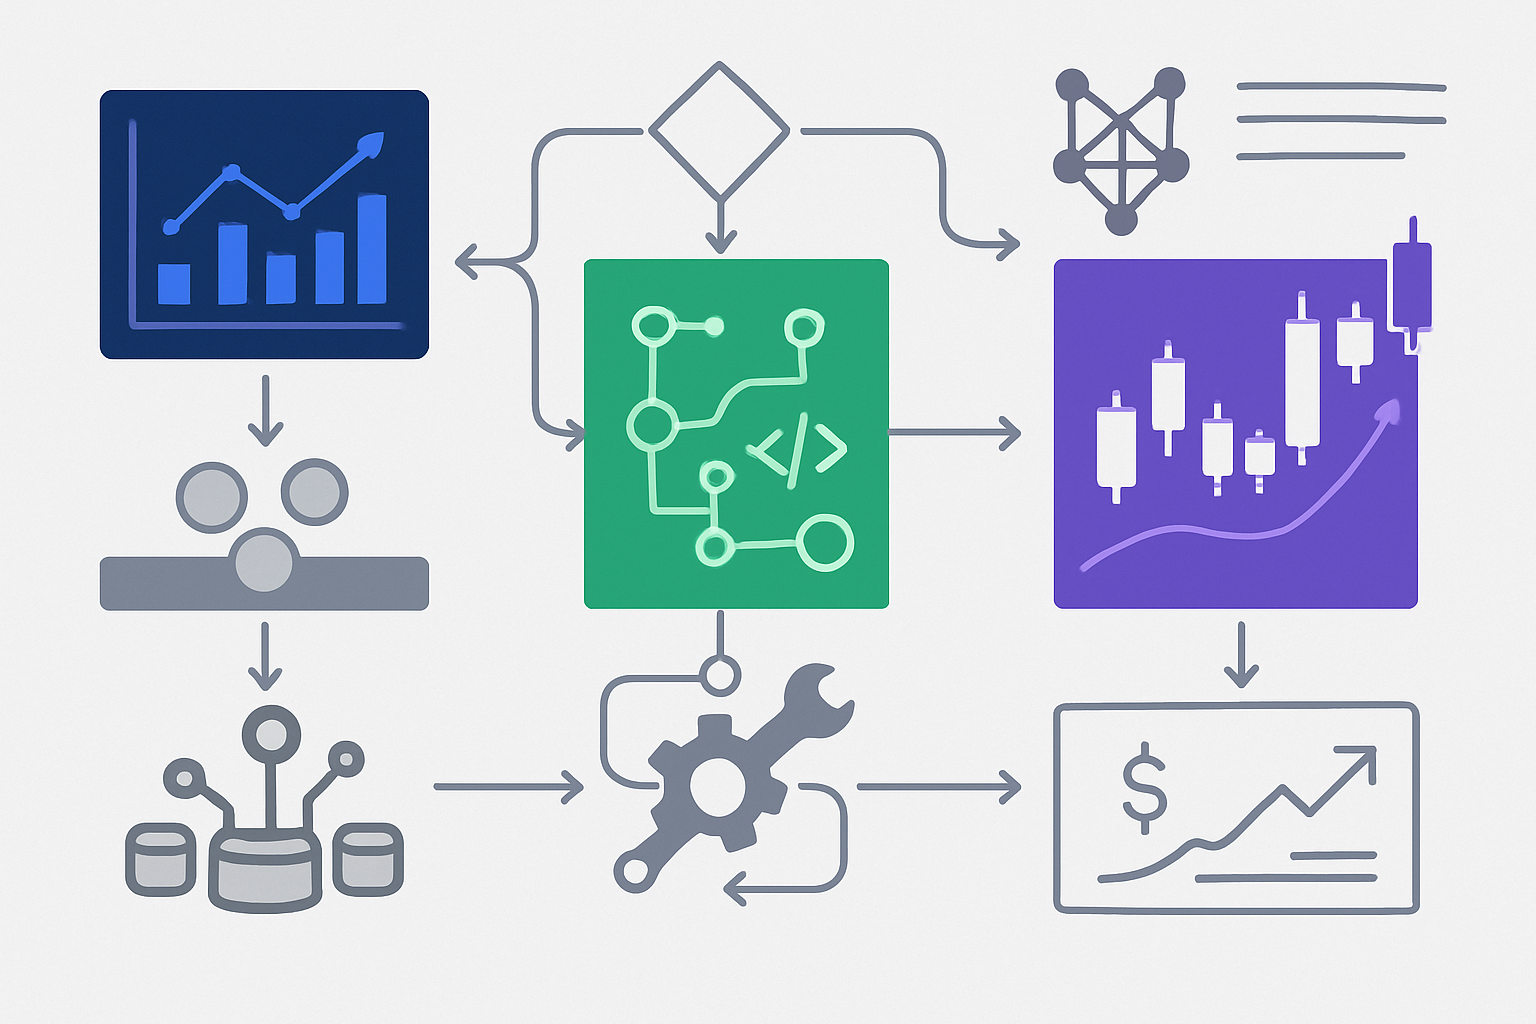
Building a Complete Edge in Blobspace Markets
No single tool provides a complete view of Celestia blob pricing trends. The most effective traders synthesize real-time analytics from Blobspace Markets with on-chain volume data, technical charting, order book depth, historical backtesting, and live sentiment tracking. This integrated approach enables you to:
- Anticipate fee volatility by correlating TIA price action (currently $0.9910) with network congestion metrics
- Optimize trade execution by leveraging CLOB DEX order books and liquidity analytics
- Validate trading strategies using robust historical datasets and statistical modeling
- React swiftly to market-moving events surfaced in social channels or developer forums
This toolkit is especially critical as average daily blob sizes continue to climb past 11.4 GB, intensifying competition for blockspace and amplifying the impact of microstructure inefficiencies. Staying ahead requires both technical rigor and adaptive market awareness.
Top Tools & Strategies for Celestia Blob Pricing Analysis (2025)
- Blobspace Markets Real-Time Analytics Dashboard: Access live metrics on blobspace usage, transaction fees, and network activity to assess current pricing trends and optimize trading strategies.

- On-chain Blob Transaction Volume Analysis via Celestia Explorer: Track real-time and historical blob transaction volumes using Celestia Explorer to identify demand spikes and fee pattern shifts.

- Technical Charting with TradingView (TIAUSD) for Blob-Related Price Correlations: Use TradingView’s TIAUSD charts to correlate TIA price movements (currently $0.9910) with blob fee trends and market volatility.
- Order Book Depth and Liquidity Monitoring on Celestia-based CLOB DEXs: Analyze order books and liquidity pools on Celestia-powered central limit order book (CLOB) DEXs to gauge market depth and slippage risks.
- Historical Blob Pricing Data Backtesting Using Python or R Scripts: Leverage open-source scripts and APIs to backtest trading strategies on historical blob pricing and fee data, refining future approaches.
- Market Sentiment Tracking from Social Channels and Developer Forums: Monitor sentiment and emerging trends on platforms like X (formerly Twitter), Discord, and Celestia’s developer forums to anticipate shifts in blobspace demand.

Actionable Next Steps for Blob Traders
If you’re serious about capturing opportunities in the evolving blobspace market, now is the time to operationalize these strategies:
- Set up custom alerts on Blobspace Markets for key fee thresholds and usage surges.
- Automate data pulls from Celestia Explorer for ongoing transaction volume monitoring.
- Create TradingView layouts overlaying TIAUSD price action with fee volatility indicators.
- Dive into order books on Celestia-based CLOB DEXs to optimize trade placement during peak activity windows.
- Build or adapt backtesting scripts in Python/R using Blobspace Markets’ historical datasets.
- Tune into sentiment signals from social channels - don’t ignore the qualitative edge.
The traders who combine these approaches will be best positioned to navigate fee spikes, capitalize on inefficiencies, and stay flexible as Celestia’s data economy matures. For additional tactical guides, visit our resource hub for Celestia blob pricing analysis.


No comments yet. Be the first to share your thoughts!