How to Analyze Celestia Data Blob Pricing Trends for Informed Trading Decisions

Celestia’s data blob market is evolving rapidly, and understanding pricing trends is essential for any trader or developer aiming to make informed decisions. With Celestia (TIA) currently priced at $1.46, the network has experienced a surge in both data blob sizes and transaction volumes, driven by NFT minting booms and new integrations. In this article, we dissect the analytics that matter most for trading Celestia blobs, providing actionable insights rooted in real-time data.
Current Blob Market Dynamics: Why Network Activity Matters
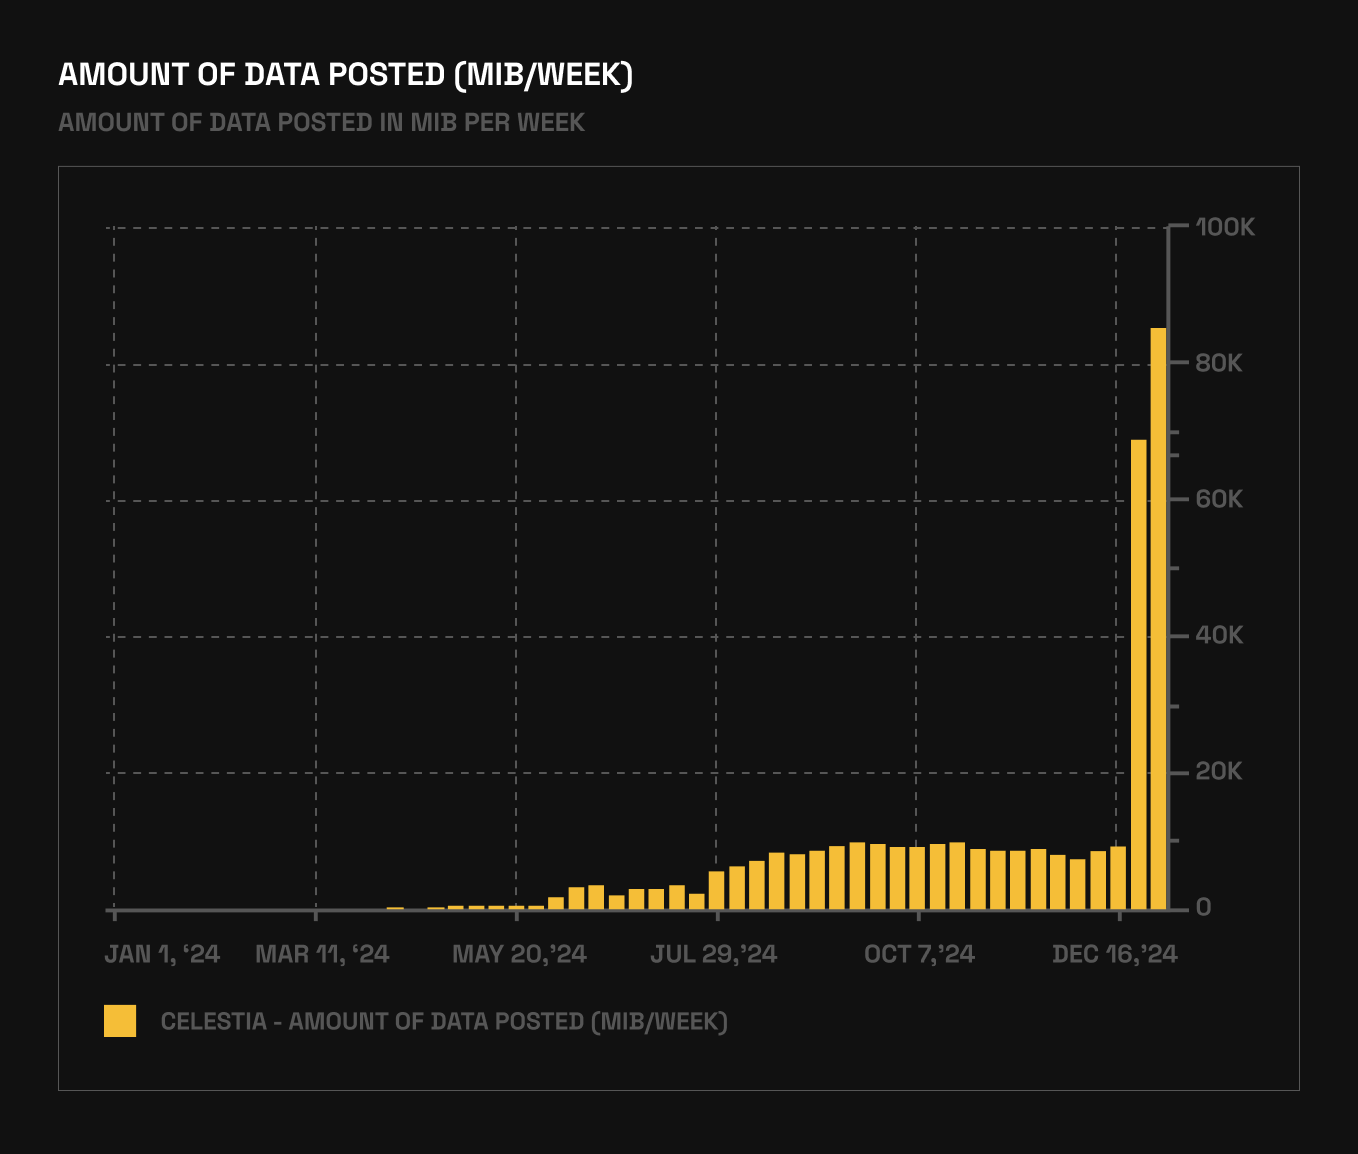
Between June 20 and December 20,2024, the average Celestia blob size hovered around 1.18 GB. In a dramatic shift over the following two weeks, that figure jumped nearly tenfold to 11.4 GB. Simultaneously, daily transactions surged by over 60%, averaging 71,000 per day (cryptonews.net). These spikes are not random; they closely align with high-profile events like the Mammoth Overlord NFT mint on Forma blockchain and increased adoption by projects such as RARI chain.
The most significant contributor during this period was Eclipse – an Ethereum Layer 2 leveraging Celestia for data availability – which accounted for approximately 95% of blobs posted. This concentration highlights how single project integrations can dramatically reshape blobspace demand and pricing dynamics.
Blob Fee Structures vs. Competitors: Cost-Efficiency Insights
Despite this massive uptick in activity, Celestia’s fee structure remains highly competitive. As of late 2024, weekly blob fees on Celestia were roughly $6,000, compared to Ethereum’s staggering $921,000 for equivalent data availability (vaneck.com). This cost differential is a critical metric for traders evaluating arbitrage opportunities or seeking to understand migration patterns between DA layers.
The cost-per-byte on Celestia remains orders of magnitude lower than Ethereum – a function of both protocol design and recent throughput upgrades. The Ginger (v3) upgrade in late 2024 reduced block time from 12 to 6 seconds while doubling throughput to 0.33 MB/s. Proposals to increase block sizes from 2 MB to 8 MB are poised to further enhance capacity (medium.com), potentially impacting future fee structures as supply constraints ease.
Interpreting Real-Time Blob Pricing Signals: Tools and Strategies
For actionable trading analytics, focus on these core indicators:
- Blob Size Volatility: Monitor sudden surges in average blob size as leading signals for fee adjustments or congestion risk.
- NFT Event Calendars: Track major NFT mints and project launches that historically drive short-term spikes in both demand and pricing volatility.
- Fee-to-Volume Ratios: Compare total fees generated versus transaction volume to gauge market efficiency and potential arbitrage windows.
- Ecosystem Integration News: Stay updated on new L2s or dApps adopting Celestia – these have outsized impacts on near-term demand curves.
The interplay between technical upgrades and organic demand growth is reshaping the landscape for blob traders. As network capacity expands, short-term price distortions may become less frequent but more pronounced during event-driven surges.
Celestia (TIA) Price Prediction 2026-2031
Professional Forecasts Based on Current Market Trends, Adoption, and Technical Analysis
| Year | Minimum Price (Bearish) | Average Price (Base Case) | Maximum Price (Bullish) | Yearly Change (%) | Market Scenario |
|---|---|---|---|---|---|
| 2026 | $1.10 | $1.80 | $3.20 | +25% | Continued steady adoption, moderate DeFi/NFT activity |
| 2027 | $1.30 | $2.15 | $4.00 | +19% | Major integrations, improved network upgrades, growing DA competition |
| 2028 | $1.60 | $2.70 | $5.10 | +26% | Regulatory clarity, increased L2 adoption, broader use cases |
| 2029 | $1.90 | $3.35 | $6.40 | +24% | Peak of next crypto cycle, Celestia as a leading DA solution |
| 2030 | $1.55 | $2.95 | $5.60 | -12% | Potential cycle correction, intensified competition, fee market pressures |
| 2031 | $1.80 | $3.50 | $7.20 | +19% | Renewed growth, maturing DA sector, new enterprise integrations |
Price Prediction Summary
Celestia (TIA) is projected to see steady growth through 2031, with periods of strong expansion tied to increased adoption of data availability (DA) solutions, network upgrades, and broader blockchain integration (especially for NFTs and L2s). The price is expected to remain volatile, with significant upside in bullish scenarios if Celestia cements itself as the leading DA layer. However, competition and market cycles could result in temporary corrections or stagnation, especially in 2030. Overall, the outlook is positive for long-term investors who closely monitor technical and fundamental developments.
Key Factors Affecting Celestia Price
- Network adoption and transaction growth (NFTs, L2s, DA use-cases)
- Upgrades increasing throughput and reducing fees (block size, block time)
- Competition from other DA providers (Ethereum, EigenDA, Avail, etc.)
- Macro crypto market cycles and investor sentiment
- Regulatory clarity around modular blockchains and data availability
- Fee market dynamics and sustainable revenue generation
- Integration by major projects (e.g., RARI chain, Eclipse)
- Potential for enterprise and cross-chain adoption
Disclaimer: Cryptocurrency price predictions are speculative and based on current market analysis.
Actual prices may vary significantly due to market volatility, regulatory changes, and other factors.
Always do your own research before making investment decisions.
Traders analyzing Celestia data blob pricing trends should combine on-chain analytics with external event monitoring for optimal results. The current market environment, Celestia (TIA) at $1.46 with daily transaction counts averaging 71,000, emphasizes the need for a dual approach: quantitative tracking of metrics and qualitative assessment of ecosystem catalysts.
Strategic Approaches: Data Blob Trading Tactics
Successful data blob trading strategies leverage both real-time analytics and predictive modeling. Here are several actionable tactics for navigating the Celestia blob market:
Top 5 Trading Tactics for Celestia Blob Market
-

Monitor Blob Size Surges Linked to Major NFT Events: Track spikes in average blob sizes—such as the recent jump from 1.18 GB to 11.4 GB—following high-profile NFT mints like Mammoth Overlord on the Forma blockchain. These events often signal increased demand and potential fee volatility.
-
Analyze Project Integrations Driving Blob Volume: Watch for integrations by major projects (e.g., RARI chain, Eclipse Layer 2) that utilize Celestia as a data availability layer. Notably, Eclipse was responsible for about 95% of blobs posted during recent surges, highlighting its outsized impact on network activity.
-

Compare Blob Fees with Ethereum for Cost Efficiency: Regularly compare Celestia’s blob fees (currently around $6,000 per week) to Ethereum’s ($921,000 per week). Lower fees can attract more projects, influencing long-term demand and TIA price action.
-
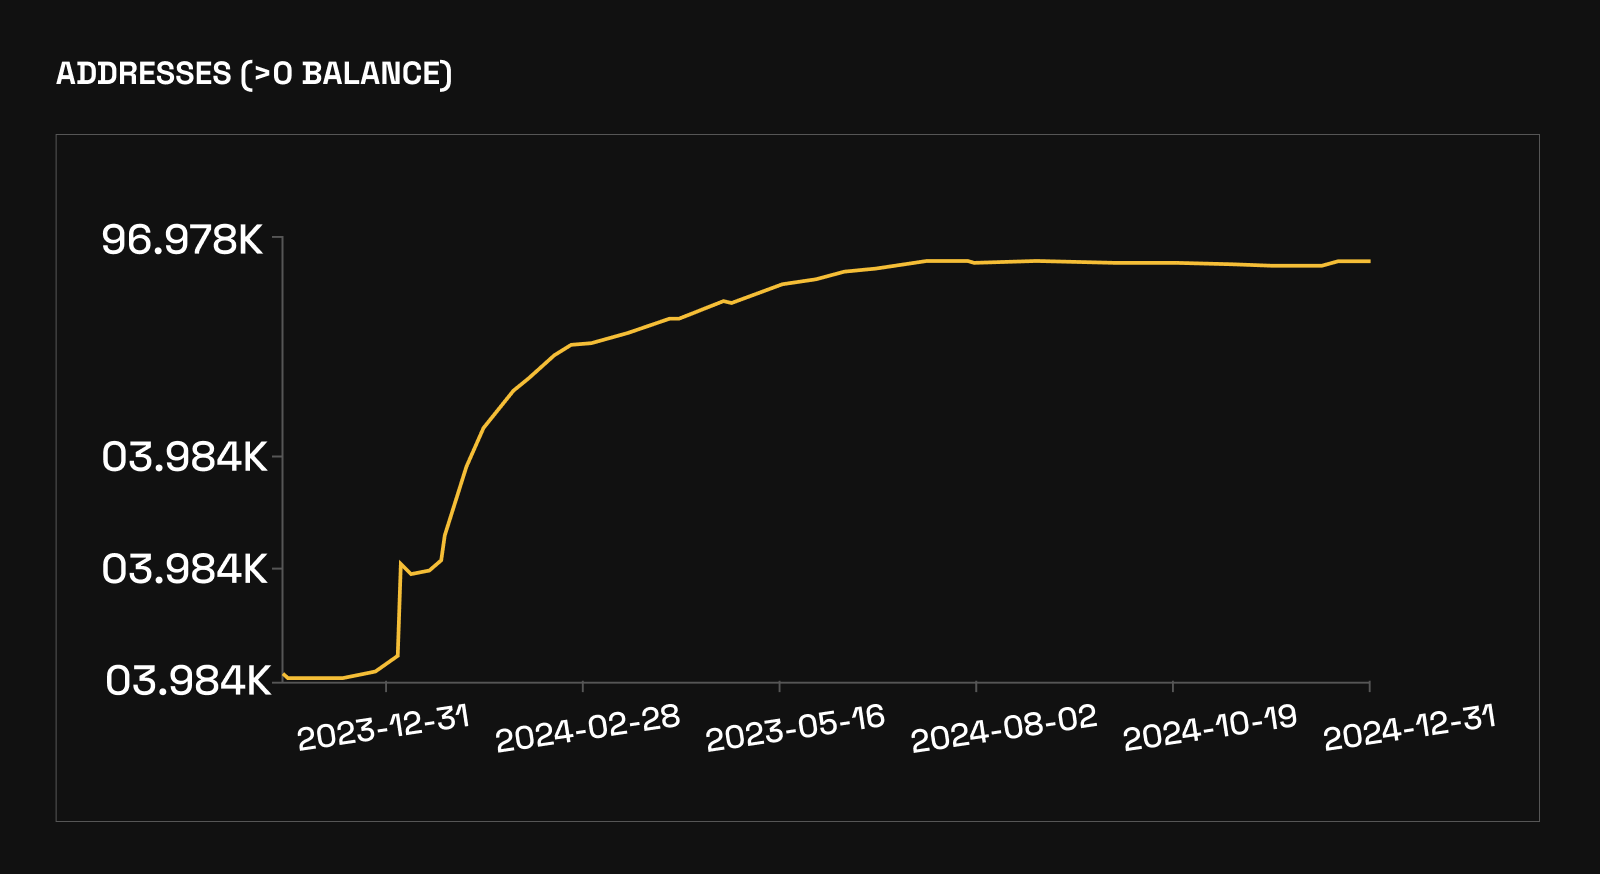
Track Network Upgrades and Throughput Enhancements: Stay informed about technical upgrades like the Ginger (v3) upgrade, which halved block time and doubled throughput. Upcoming proposals to increase block sizes (from 2MB to 8MB) may further impact blob pricing and trading opportunities.
-
Correlate Transaction Volume Spikes with Price Movements: Analyze how daily transaction volume increases (recently up 60% to 71,000/day) relate to TIA price shifts (currently $1.46, down 3.95% in 24h). Use analytics dashboards (e.g., Blockworks Research) for real-time monitoring and informed entry/exit timing.
1. Monitor Throughput Upgrades: Protocol improvements like Ginger (v3) and upcoming block size increases can rapidly shift supply constraints, impacting both short-term pricing and longer-term fee structures. Traders should anticipate price normalization following major upgrades, but also watch for volatility as the network adjusts to new capacity baselines.
2. Arbitrage Between DA Layers: The persistent gap between Celestia’s weekly blob fees ($6,000) and Ethereum’s ($921,000) creates opportunities for arbitrage, particularly when NFT or L2 activity spikes on one chain but not the other. Track cross-chain migration flows to spot these windows early.
3. Sentiment and News Analysis: Integrations like Eclipse’s adoption of Celestia, or large-scale NFT mints such as Mammoth Overlord, often precede volume surges and fee spikes. Use social media sentiment tools and project announcement feeds to front-run market reactions.
4. Real-Time Fee Monitoring: Set up alerts for sudden changes in average blob fee rates or transaction throughput. These are frequently precursors to short-lived price dislocations that can be exploited by nimble traders.
5. Historical Pattern Recognition: Backtest previous event-driven surges using historical pricing and volume data to identify repeatable patterns or seasonal effects in the Celestia blob ecosystem.

Advanced Analytics Tools: Staying Ahead in Blob Trading
The most effective traders utilize a suite of analytics dashboards and real-time alerting systems tailored specifically to Celestia’s evolving market structure. Platforms such as Blockworks’ analytics dashboard, combined with technical indicators from TradingView or Bitget, provide granular insight into both macro trends and microstructure shifts.
A robust strategy should also include comparative analysis tools that benchmark Celestia against competing DA layers, not just on headline fees but on latency, reliability, and integration velocity across the ecosystem.
The Bottom Line: Data-Driven Decision Making
The future of Celestia data blob trading will be shaped by a confluence of technical upgrades, user adoption waves, and shifting cost dynamics versus legacy solutions like Ethereum. With TIA holding steady at $1.46, near-term volatility will likely center around event-driven demand spikes, particularly those tied to NFT launches or major L2 integrations.
Ultimately, traders who systematically track network metrics alongside external catalysts will be best positioned to capitalize on emerging opportunities in this rapidly evolving market segment.


