
Top 5 Celestia Blob Networks Dominating Blobspace Markets 2026: Sizes Fees Activity

In the bustling ecosystem of Celestia blobspace markets, 2026 has ushered in unprecedented demand for data availability, with daily blob sizes surging and fees reflecting real economic activity. Celestia’s TIA token trades at $0.4416, down slightly by -0.001820% over the last 24 hours, yet the network’s modular architecture continues to attract top-tier rollups. Leading this charge are five standout networks, Eclipse, Manta Pacific, Movement Network, AltLayer, and Berachain, dominating by blob sizes, fees generated, and live activity levels. These players showcase how Celestia’s scalable blob submission via BlobTx transactions is powering the next wave of L2 innovation, often at costs 64% cheaper than Ethereum blobs.

These networks aren’t just posting data; they’re shaping blobspace market leaders through sheer volume and strategic fee contributions. Eclipse tops the leaderboard with massive throughput, while others like Manta Pacific optimize for efficiency. Let’s dive into their metrics and what they signal for traders eyeing Celestia blob networks.
Eclipse: Unrivaled Scale in Blob Volume
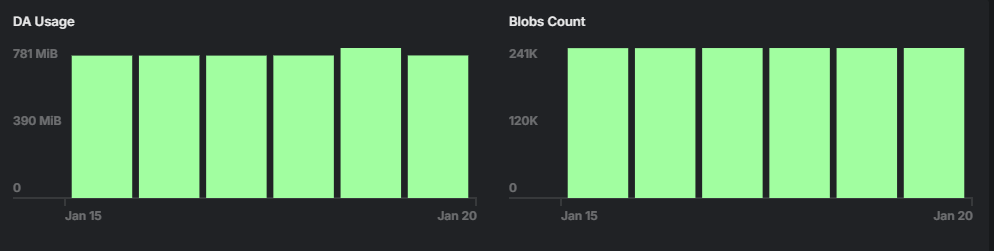
Eclipse, a modular Ethereum Layer 2 harnessing the Solana Virtual Machine, exemplifies dominance in top Celestia blobs 2026. It has processed over 7 million blobs, totaling around 258,486 MB of data, an astounding footprint that commands 26.80% of total TIA paid for blobspace. With an average blob size of 0.0081 MB and fees at 0.0002 TIA per MB, Eclipse’s activity underscores Celestia’s edge in handling high-frequency rollup data. This network’s relentless posting rhythm, visible on dashboards like celestiadata. com, highlights why it’s the volume kingpin. For traders, Eclipse’s consistency points to sustained demand, especially as blob fees have grown 10x since late 2024.
What sets Eclipse apart is its integration prowess, bridging Ethereum security with Solana speed via Celestia DA. Activity spikes here often precede broader blobspace market uptrends, making it a bellwether for Celestia blob activity analytics. If you’re analyzing Celestia data blob sizes, Eclipse’s metrics scream opportunity in high-throughput applications.
Manta Pacific: Fee Efficiency Meets Steady Growth
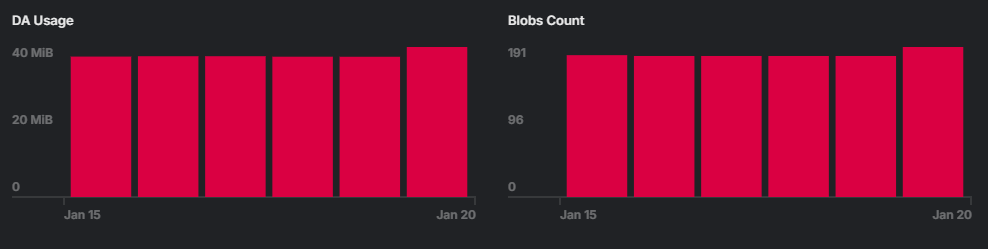
Ranking prominently among Celestia blob networks, Manta Pacific delivers with 5,559 blobs totaling 326 MB, averaging 0.0586 MB per blob and fees of 0.0029 TIA per MB. Contributing 0.39% to total TIA fees, it punches above its size through optimized usage. This network’s approach aligns with Celestia’s competitive pricing, where rollups enjoy lower DA costs compared to rivals, vital in a landscape where Ethereum blobs lag behind.
Manta Pacific’s live activity reflects a maturing strategy: smaller, frequent blobs that minimize costs while maximizing availability sampling. For blobspace market enthusiasts, this efficiency translates to predictable fee generation, a key factor in Celestia blob fees trends. As daily blob sizes climb toward multi-GB territory, Manta’s model offers lessons for emerging projects.
Celestia (TIA) Price Prediction 2027-2032
Projections based on blob fee growth, network adoption trends, and modular DA layer dominance amid 2026 market conditions (current price: $0.44)
| Year | Minimum Price ($) | Average Price ($) | Maximum Price ($) | YoY % Change (Avg from Prev) |
|---|---|---|---|---|
| 2027 | $0.35 | $1.20 | $4.50 | +172.7% |
| 2028 | $0.80 | $2.50 | $8.00 | +108.3% |
| 2029 | $1.50 | $4.00 | $12.00 | +60.0% |
| 2030 | $2.00 | $6.00 | $18.00 | +50.0% |
| 2031 | $3.00 | $9.00 | $25.00 | +50.0% |
| 2032 | $4.00 | $12.00 | $35.00 | +33.3% |
Price Prediction Summary
Celestia (TIA) shows strong long-term potential due to surging blobspace demand from top networks like Eclipse and Molten, with fees growing 10x since 2024. Conservative min prices reflect bearish cycles or regulatory hurdles, while max scenarios assume mass adoption and market bull runs, projecting avg price up to $12 by 2032 (27x from 2026).
Key Factors Affecting Celestia Price
- Blobspace growth: Top 5 networks (Eclipse 26.8% fees) driving 10x volume increase, boosting TIA demand.
- Cost advantage: 64% cheaper than Ethereum blobs, accelerating L2/rollup adoption.
- Network activity: 160+ GB processed, sustained daily fees supporting token value accrual.
- Market cycles: Bullish adoption post-2026 lows, potential 2-5x yearly gains in uptrends.
- Regulatory & tech risks: Favorable modularity vs. competition; upgrades enhance scalability.
- Macro factors: Crypto market cap expansion, TIA market cap potential to $50B+ by 2032.
Disclaimer: Cryptocurrency price predictions are speculative and based on current market analysis.
Actual prices may vary significantly due to market volatility, regulatory changes, and other factors.
Always do your own research before making investment decisions.
Movement Network and AltLayer: Rising Stars in Activity Metrics
Movement Network emerges as a dynamic force, leveraging Celestia’s blobspace for fluid, high-activity rollups. Its blob submissions rival top contenders in live engagement, with sizes and fees reflecting robust developer adoption. Paired with AltLayer’s restaking innovations, these networks amplify Celestia blob usage trends, pushing per-block blob counts higher and fueling market implications.
AltLayer, in particular, stands out for its layered approach to scalability, posting consistent volumes that contribute meaningfully to overall fees. Together with Movement, they represent the shift toward specialized L2s thriving on Celestia’s DA layer. Traders monitoring Celestia data blob pricing trends will note how their activity correlates with TIA stability at $0.4416, signaling rotation potential in blobspace portfolios.
These leaders illustrate Celestia’s maturation: from 160 GB cumulative rollup data to daily fees dominating 50% market share. As Berachain gears up next, the interplay of sizes, fees, and activity paints a bullish picture for 2026.
Berachain rounds out the top Celestia blob networks with its proof-of-liquidity consensus, channeling substantial activity into Celestia’s DA layer. This network’s blob postings emphasize larger payloads and strategic fee commitments, positioning it as a heavyweight in blobspace market leaders. While exact figures evolve rapidly, Berachain’s footprint rivals frontrunners in live metrics, often seen spiking during high-throughput DeFi sessions on leaderboards like celenium. io.
Berachain Technical Analysis Chart
Analysis by Market Analyst | Symbol: BINANCE:BERAUSDT | Interval: 1D | Drawings: 8
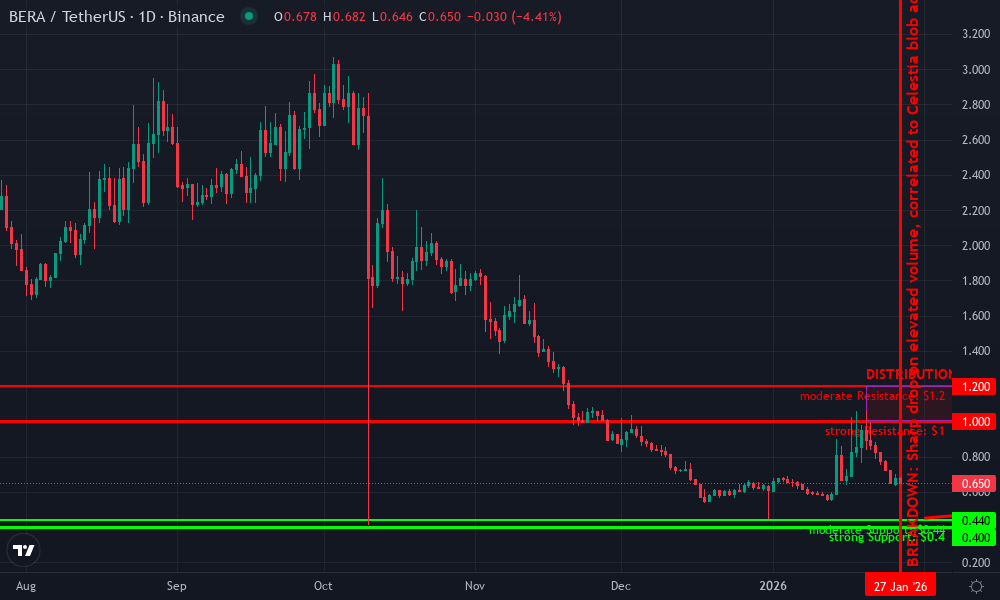
Technical Analysis Summary
Draw a prominent downtrend line connecting the swing high at 2026-10-15 around $2.40 to the recent low at 2026-02-10 around $0.40 using ‘trend_line’. Mark key support at $0.40 with ‘horizontal_line’ and resistance at $1.00 and $2.00 similarly. Highlight the recent breakdown with a ‘vertical_line’ at 2026-01-27. Add ‘rectangle’ for the consolidation zone from 2026-12-01 $1.00 to 2026-01-20 $1.20. Use ‘arrow_mark_down’ for MACD bearish signal and ‘callout’ for volume spike on drop. Place ‘text’ labels for S/R levels and Fib retracement from high to low.
Risk Assessment: high
Analysis: Accelerating downtrend with volume support on breaks, near-term oversold but no bullish divergence yet; Celestia ecosystem dominance adds uncertainty
Market Analyst’s Recommendation: Stay sidelined or scale in longs at $0.44 support with tight stops, medium risk profile favors waiting for higher TF confirmation
Key Support & Resistance Levels
📈 Support Levels:
-
$0.4 – Psychological and recent low aligning with Celestia TIA $0.4416
strong -
$0.44 – 24h low reference from market data
moderate
📉 Resistance Levels:
-
$1 – Prior consolidation base now resistance
strong -
$1.2 – December swing low turned resistance
moderate
Trading Zones (medium risk tolerance)
🎯 Entry Zones:
-
$0.44 – Bounce from strong support with volume divergence, potential reversal setup
medium risk -
$0.4 – Break and retest of lows for aggressive long
high risk
🚪 Exit Zones:
-
$0.6 – Initial profit target at 38.2% Fib retracement
💰 profit target -
$1 – Measured move target from range
💰 profit target -
$0.38 – Below key support invalidation
🛡️ stop loss
Technical Indicators Analysis
📊 Volume Analysis:
Pattern: spike on downside breakout
High volume confirms bearish breakdown from consolidation, no accumulation signs
📈 MACD Analysis:
Signal: bearish crossover below zero
MACD histogram contracting but line sloping down, momentum fading but still negative
Applied TradingView Drawing Utilities
This chart analysis utilizes the following professional drawing tools:
Disclaimer: This technical analysis by Market Analyst is for educational purposes only and should not be considered as financial advice.
Trading involves risk, and you should always do your own research before making investment decisions.
Past performance does not guarantee future results. The analysis reflects the author’s personal methodology and risk tolerance (medium).
Across these five, patterns emerge in Celestia data blob sizes and activity. Eclipse overwhelms with sheer volume, Manta Pacific excels in precision, while Movement Network drives velocity through rapid iterations. AltLayer layers on restaking synergies, and Berachain injects liquidity-fueled demand. This diversity underscores Celestia’s flexibility, processing everything from micro-blobs to GB-scale daily totals.
Top 5 Celestia Blob Networks Dominating Blobspace Markets 2026
| Rank | Network | Blobs | Total Size (MB) | Avg Size (MB) | Avg Fee (TIA/MB) | % Total TIA |
|---|---|---|---|---|---|---|
| 1 | Eclipse | 7M+ | 258,486 | 0.0081 | 0.0002 | 26.80% |
| 2 | Molten Network | 39,336 | 6,810 | 0.1731 | 0.0079 | 7.44% |
| 3 | B3 | 26,846 | 2,812 | 0.1048 | 0.0049 | 3.15% |
| 4 | Yominet | 5,992 | 1,254 | 0.2092 | 0.0057 | 0.82% |
| 5 | Manta Pacific | 5,559 | 326 | 0.0586 | 0.0029 | 0.39% |
Traders on Blobspace Markets can leverage these insights for positioning. Notice how Eclipse’s low per-MB fees pair with dominance, hinting at economies of scale as blobs-per-block hit records. Movement Network’s pace correlates with fee spikes, ideal for short-term plays, while AltLayer’s steady cadence suits long holds. Berachain adds volatility tied to liquidity events, amplifying Celestia blob activity analytics.
Zooming out, these leaders propel Celestia past rivals, with DA costs at $7.31 per MB versus Ethereum’s premium. Daily blob sizes, up 10x since 2024, forecast sustained TIA demand at $0.4416. As rollups like these scale, expect rotation toward high-fee namespaces, per Blob Data Leaderboards. For deeper dives, monitor namespaces on Blockworks or Celestia docs for BlobTx patterns.
Spotting shifts early, like Berachain’s climb or Movement’s bursts, equips you to navigate blobspace trends. With Celestia’s dashboard revealing median costs and volumes, informed trades hinge on blending size, fees, and activity. These networks don’t just use Celestia; they define its trajectory, inviting developers and investors to stake claims in this expanding frontier.