
Celestia’s data availability layer is rapidly becoming a focal point for developers and analysts seeking cost-effective alternatives to Ethereum’s blob infrastructure. With Celestia (TIA) currently priced at $1.01 and a surge in both blob sizes and transaction counts, understanding how to analyze blob costs and fee trends is critical for anyone operating in this evolving ecosystem. Leveraging tools like Blobscan and Dune Analytics, users can extract actionable insights into blobspace pricing, fee dynamics, and market shifts.
Celestia Blob Costs: Where Do We Stand at $1.01?
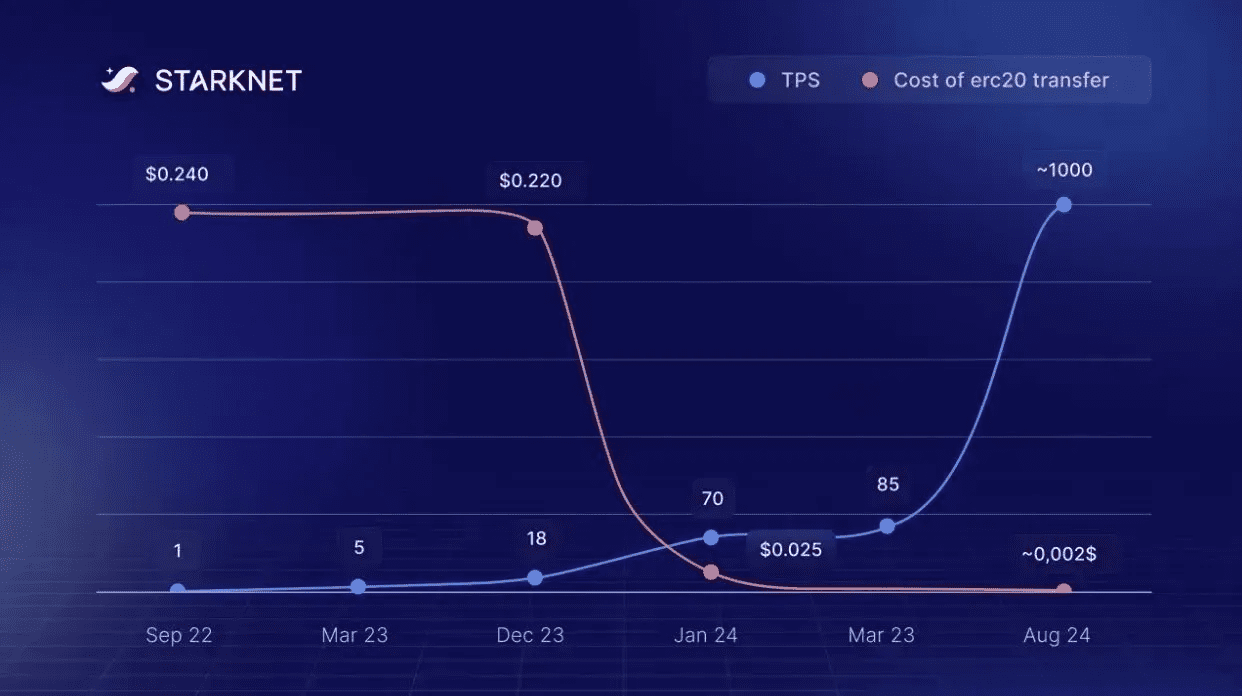
Recent market data underscores Celestia’s competitive edge in data availability fees. According to Conduit, Celestia’s average cost is $7.31 per MB, a staggering 64% cheaper than Ethereum blobs, which average $20.56 per MB. However, more granular data from the Celestia Forum suggests that the current DA fee sits at approximately $0.08 per MB, with typical rollup transaction costs around $0.00002. This positions Celestia as a near-1000x cost advantage over Ethereum’s EIP-4844 blobs, especially relevant given the current TIA price of $1.01.
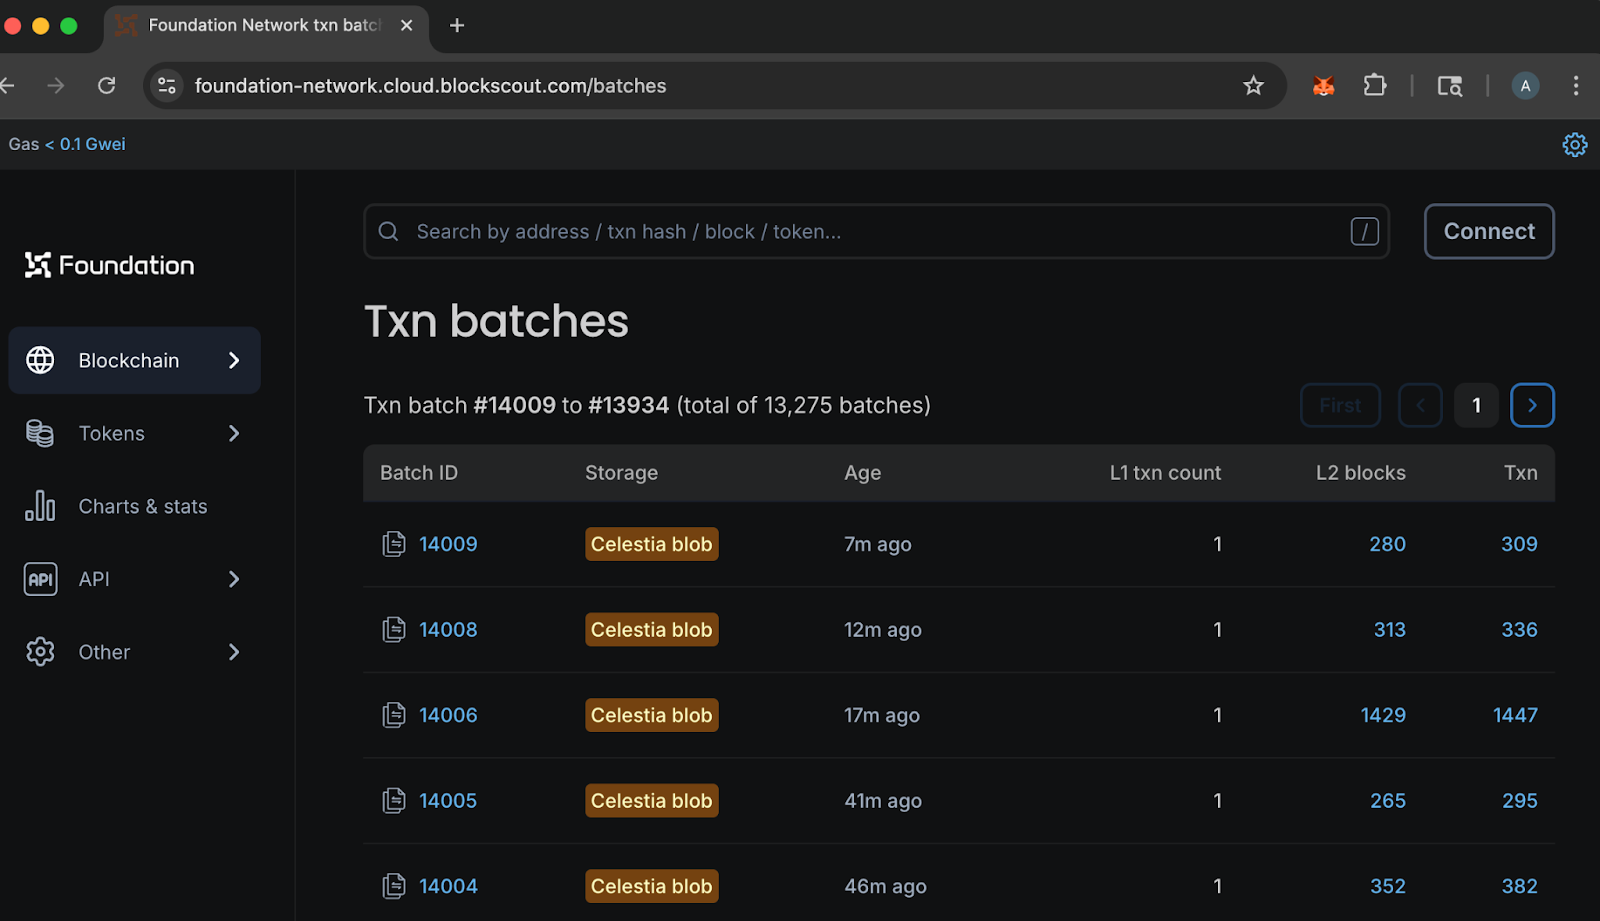
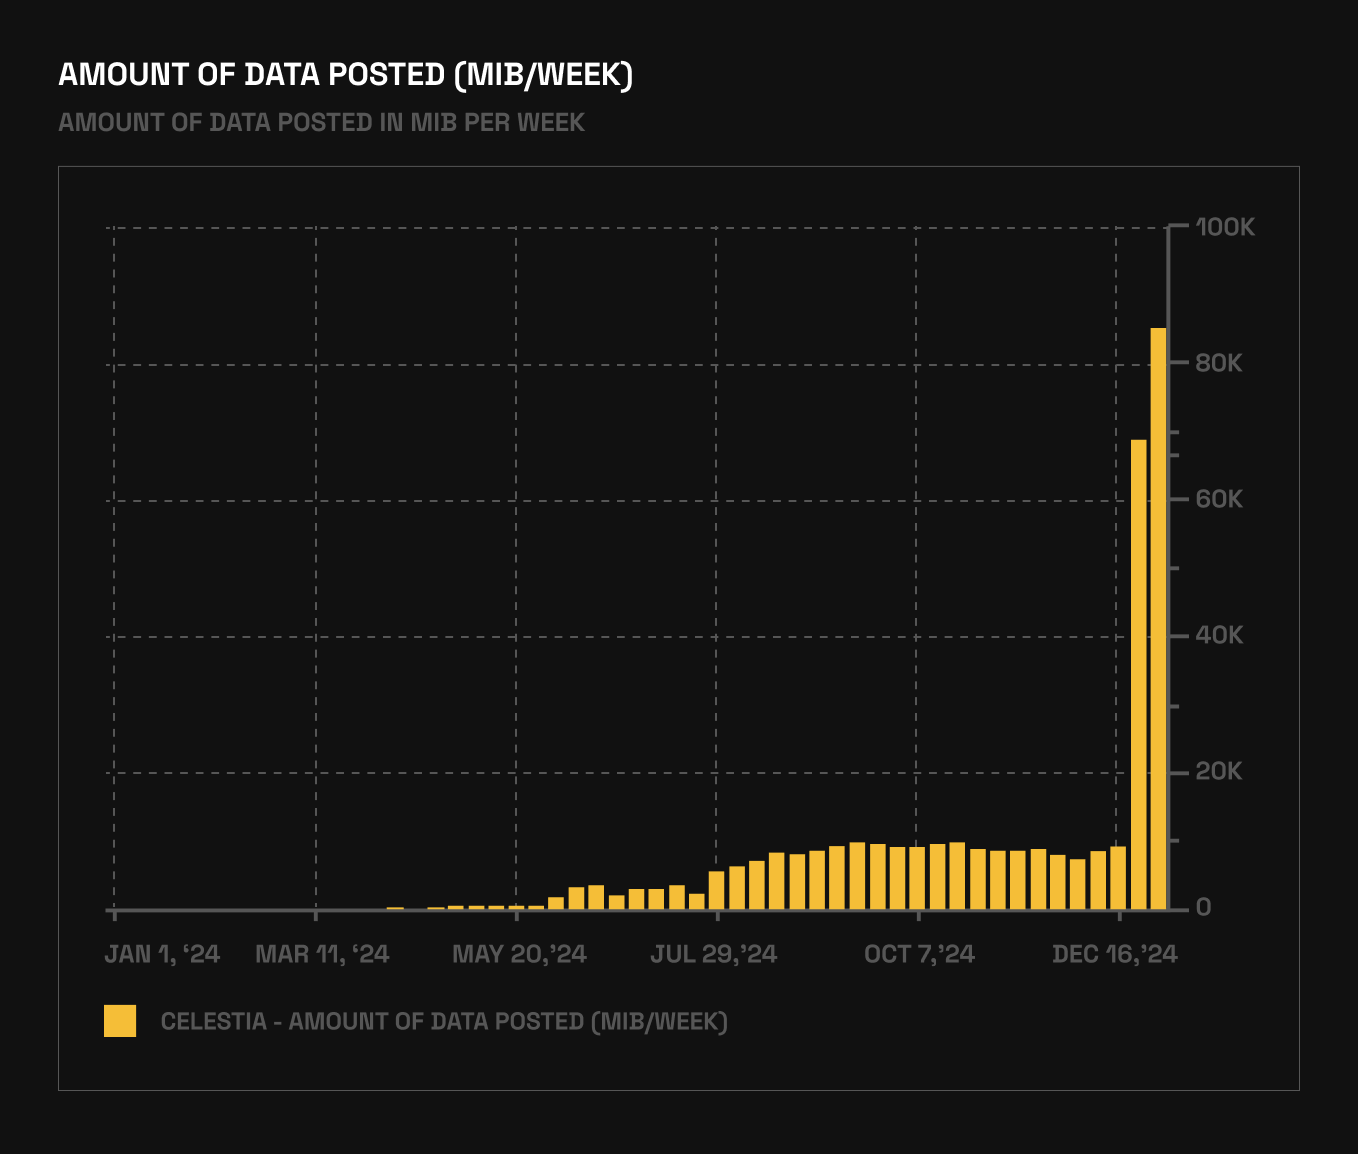
The spike in blob sizes, rising tenfold from 1.18 GB to 11.4 GB over the last two weeks, reflects both increased utility (notably from NFT minting and new projects) and heightened demand for cost-efficient DA solutions. To navigate this landscape, market participants need robust analytics to dissect both historical and real-time blob fee trends.
Using Blobscan: Visualizing Blob Transaction History and Cost Trends
Blobscan is the go-to explorer for tracking Celestia’s blob transaction history. The platform provides granular data on:
- Blob size distribution per block
- Fee rates (flat and variable, based on blob size)
- Transaction throughput and daily activity spikes
By filtering for periods of high activity, such as recent NFT launches, users can correlate spikes in blob sizes with fee volatility. The data reveals that while Celestia’s fee structure is designed to scale linearly with usage, sudden surges in demand (like the recent 10x increase in average blob size) can still create upward pressure on fees. Blobscan’s charts make these trends visually accessible, supporting both historical backtesting and forward-looking fee forecasts.
Dune Analytics: Deep-Dive Into Fee Trends and Market Dynamics
Dune Analytics complements Blobscan by offering customizable SQL queries and dashboards for Celestia blob analytics. Key metrics include:
- Average blob cost per MB, updated in real time
- Fee volatility around major events (e. g. , Dencun upgrade, NFT mints)
- Blob consumption thresholds (e. g. , demand between 3.13-3.20 blobs per block, per Ethereum Research)
For example, Dune dashboards allow users to compare the cost of posting 0.128 MB as Celestia blobs versus Ethereum calldata, quantifying savings at current market rates. Analysts can also track how changing minimum gas prices or parameter updates impact overall DA fees, especially as network activity scales.
Celestia (TIA) Price Prediction 2026-2031
Forecast based on data availability trends, blob fee dynamics, and adoption as a modular DA layer
| Year | Minimum Price | Average Price | Maximum Price | Year-on-Year Change (%) | Scenario Insights |
|---|---|---|---|---|---|
| 2026 | $0.88 | $1.12 | $1.40 | +11% | Blobspace demand grows moderately; price volatility as DA competition intensifies |
| 2027 | $0.95 | $1.28 | $1.75 | +14% | New L2 integrations boost adoption; regulatory clarity supports upside |
| 2028 | $1.05 | $1.45 | $2.10 | +13% | Modular blockchain narrative strengthens; NFT and rollup activity drive usage |
| 2029 | $1.18 | $1.65 | $2.45 | +14% | Scalability upgrades lower fees, inviting more activity; competition from other DA layers emerges |
| 2030 | $1.30 | $1.85 | $2.80 | +12% | Mainstream adoption of modular DA; potential for new revenue streams (e.g., data marketplaces) |
| 2031 | $1.18 | $2.00 | $3.10 | +8% | Market matures; growth steadies as ecosystem stabilizes, but innovation could spark new cycles |
Price Prediction Summary
Celestia (TIA) is projected to see steady growth over the next six years, fueled by rising demand for efficient data availability solutions and increased usage by rollups and NFT projects. Prices may fluctuate with market cycles and competitive pressures, but the trend remains positive, especially if Celestia maintains its cost advantage and continues technical innovation.
Key Factors Affecting Celestia Price
- Blobspace demand and transaction growth from L2s and NFTs
- Celestia’s cost advantage over Ethereum and other DA layers
- Adoption by new rollups and modular blockchains
- Regulatory developments affecting DA tokens and rollup projects
- Scalability and technical improvements (e.g., lower fees, larger blobs)
- Competition from alternative DA solutions (EigenDA, Avail, etc.)
- Macro crypto market cycles and investor sentiment
Disclaimer: Cryptocurrency price predictions are speculative and based on current market analysis. Actual prices may vary significantly due to market volatility, regulatory changes, and other factors. Always do your own research before making investment decisions.
What Drives Blob Fee Surges? Case Studies and Actionable Metrics
The phenomenon of sudden, exponential increases in blob prices, such as the 100 billion-fold surge observed during specific upgrades, highlights the importance of monitoring both protocol-level changes and external demand shocks. Fee spikes often correspond with:
- Protocol upgrades (e. g. , Dencun, parameter changes)
- NFT minting waves
- Rollup launches or migrations
Effective use of Blobscan and Dune Analytics enables market participants to anticipate these events, hedge exposure, or capitalize on arbitrage opportunities between Celestia and Ethereum DA layers. For further strategies on mitigating fee volatility during such events, see our guide on managing blob fee spikes.
Comparing Celestia’s current $1.01 TIA price environment to historical fee regimes, it’s clear that modular DA layers are not immune to volatility. As average blob sizes continue to expand, especially during periods of heightened on-chain activity, users must pay close attention to real-time analytics for actionable signals. Both Blobscan and Dune deliver the granularity needed to separate noise from signal in blob costs Celestia markets.
Key Metrics to Monitor: Celestia Blob Analytics in Practice
To stay ahead of fee trends, focus on these high-signal metrics:
Essential Celestia Blob Analytics Metrics to Track
- Average Blob Size: Monitoring the average blob size on Celestia reveals network usage trends—recent data shows a surge from 1.18 GB to 11.4 GB, indicating increased activity from NFT minting and rollup adoption.
- Blob Fee per MB: Track the average fee per MB paid for blobspace. Celestia's current average is $7.31 per MB, significantly lower than Ethereum's $20.56 per MB, highlighting its cost efficiency.
- Daily Blob Transaction Count: The number of blob transactions per day reflects demand and network congestion. Recent spikes are linked to increased project activity and NFT launches.

- Minimum Gas Price and DA Fees: Analyze the minimum gas price and data availability (DA) fees. Celestia currently charges around $0.08 per MB and about $0.00002 per rollup transaction, making it approximately 1,000x cheaper than EIP-4844 calldata.
- Blobspace Utilization Rate: The utilization rate measures how much of the available blobspace is being used. High utilization may signal rising demand and potential fee increases.

- Blob Gas Price Trends: Tracking blob gas price fluctuations helps anticipate fee volatility. Notably, blob prices have demonstrated the capacity for rapid surges, as seen during major network events.
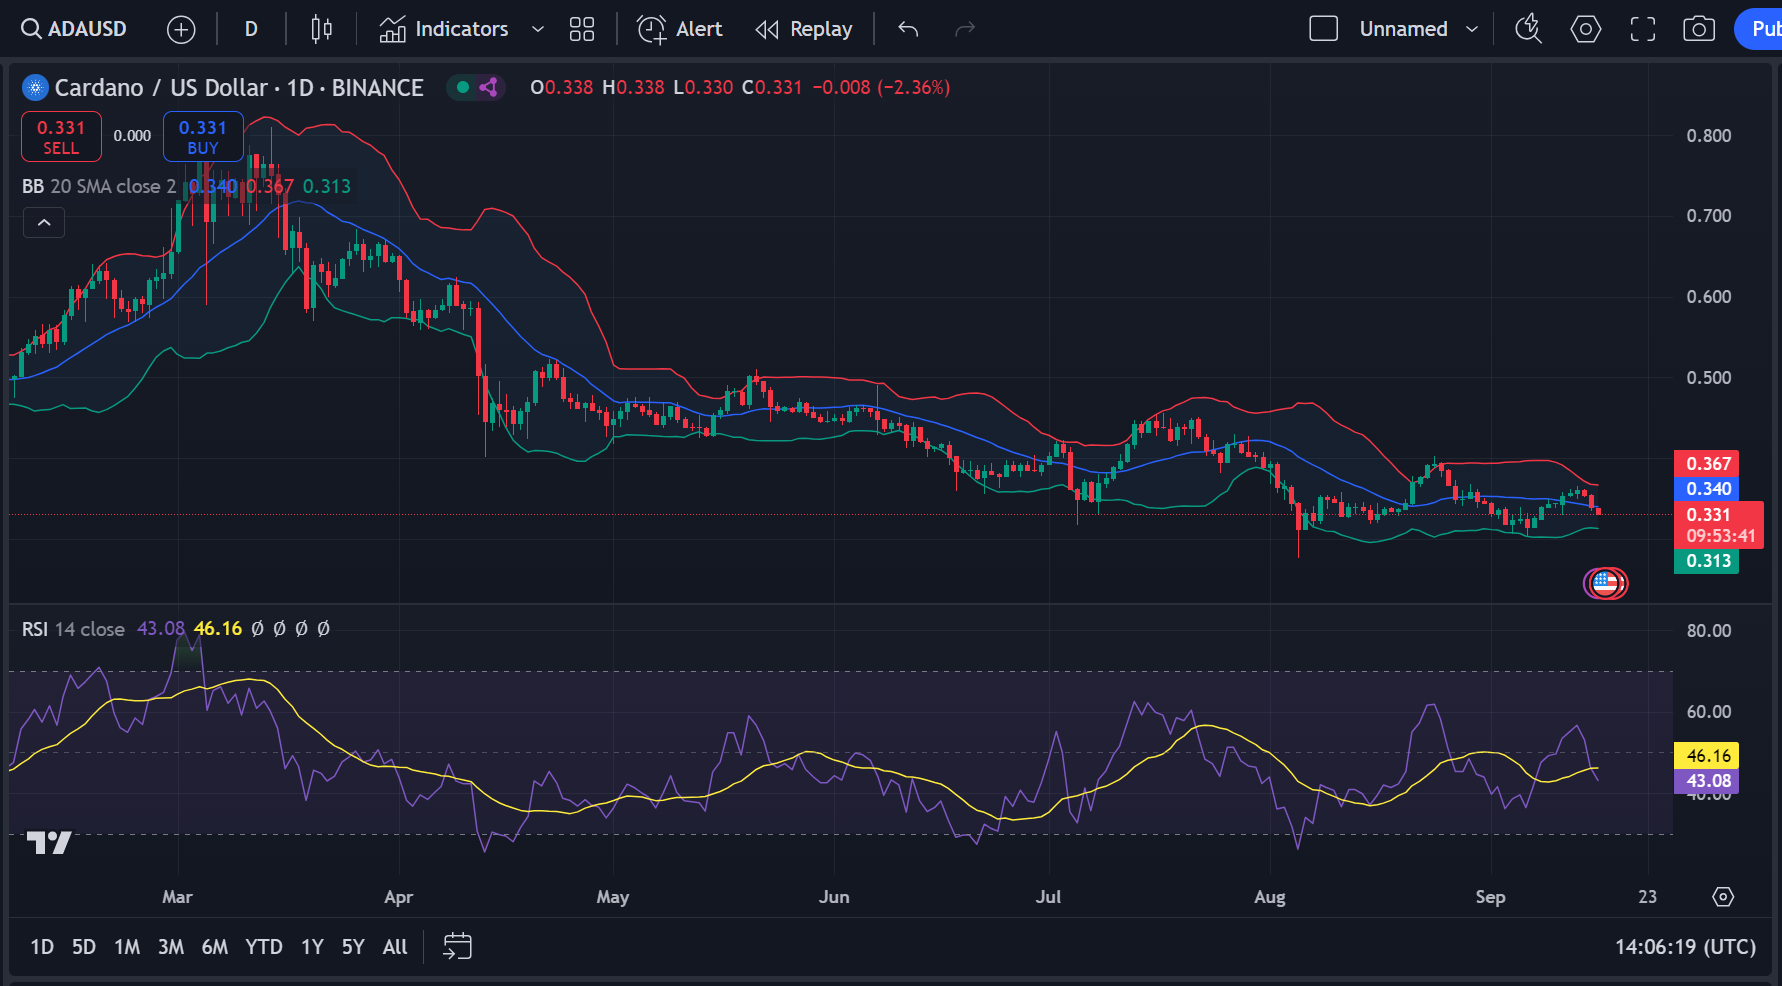
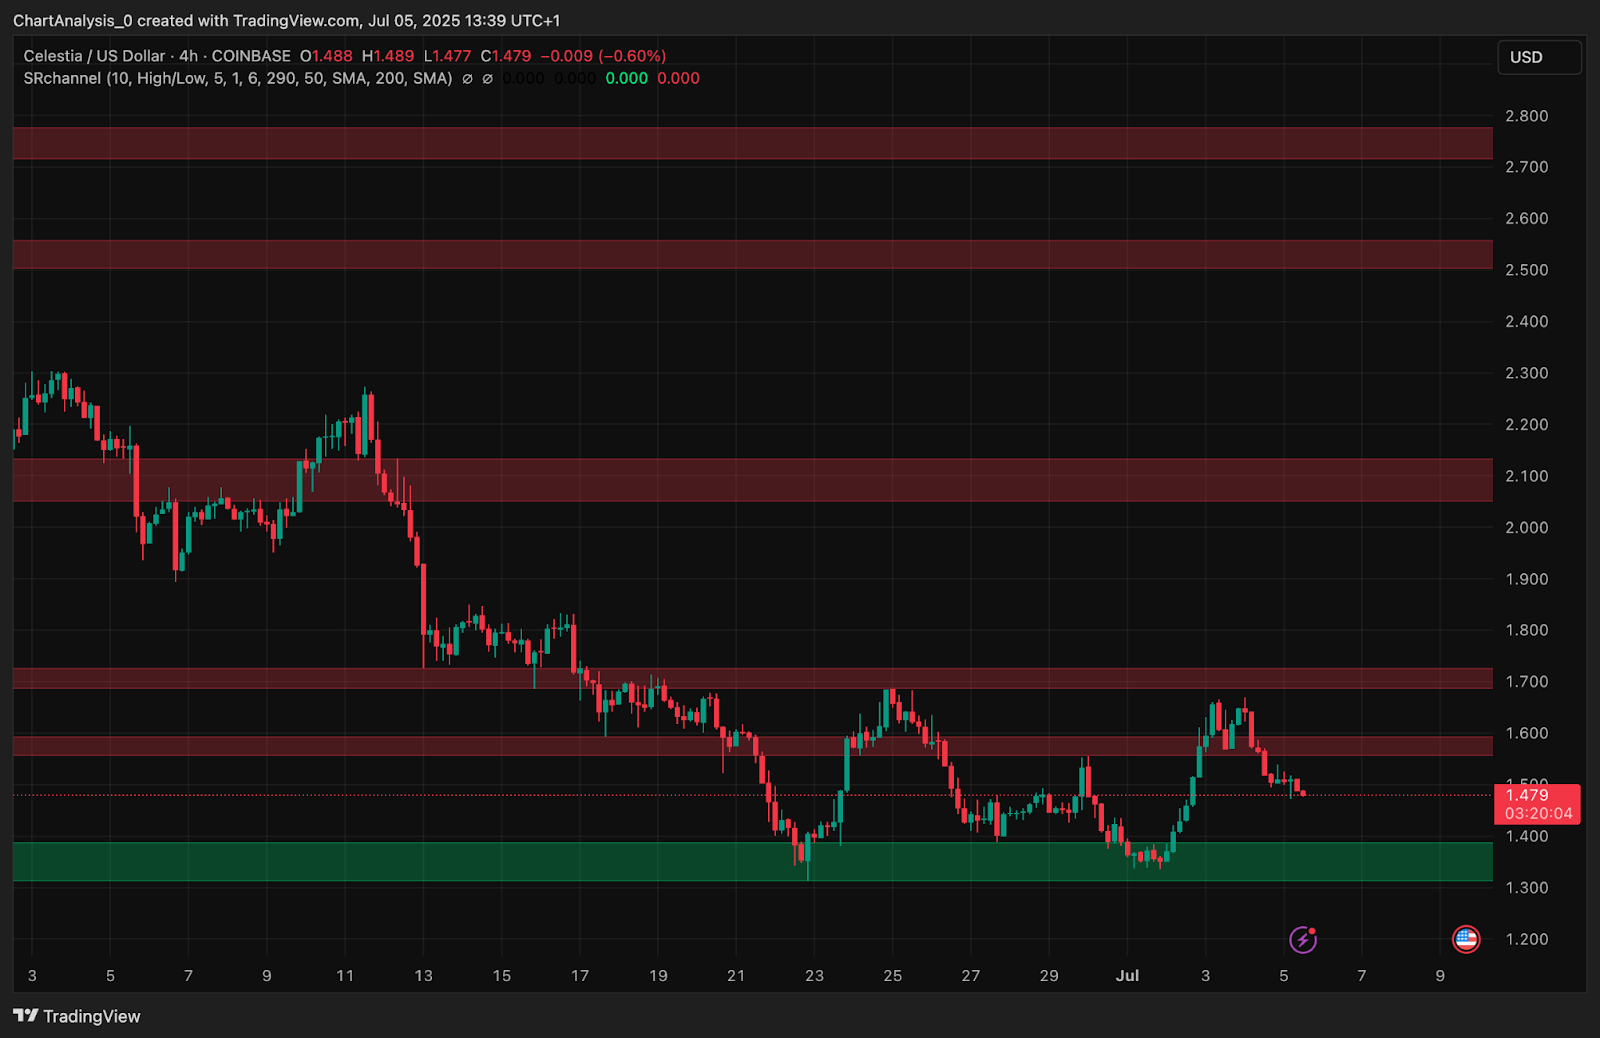
- Celestia (TIA) Price Movements: Correlate blob activity with Celestia (TIA) price. As of now, TIA trades at $1.01 (24h high: $1.02, low: $0.9877), with a +$0.002000 (+0.001990%) daily change.
- Blob size and block fullness: Track how average blob size correlates with fee spikes, especially during NFT launches or rollup onboarding.
- Fee per MB over time: Use Dune to visualize historical trends and spot regime shifts or outlier events.
- Blob transaction history: Identify recurring patterns around protocol upgrades or major ecosystem announcements.
- Minimum gas price adjustments: Parameter updates can have an outsized impact on DA costs; monitor these closely.
By leveraging these metrics, traders and developers can build robust models for fee forecasting, risk management, and opportunity identification within the Celestia blobspace ecosystem.
“Correlations reveal hidden truths. When blob sizes surge, fees don’t always follow linearly, watch for inflection points in both supply and demand curves. ”
Actionable Strategies: Navigating Blob Fee Volatility at $1.01 TIA
With Celestia (TIA) holding steady at $1.01, market participants should:
- Backtest fee sensitivity to blob size and activity spikes using historical data from Blobscan and Dune.
- Set alerts for abnormal fee increases or block fullness thresholds, particularly during high-profile launches.
- Compare DA costs across Celestia and Ethereum using real-time dashboards to identify arbitrage or migration opportunities.
- Monitor parameter proposals on the Celestia Forum, as changes can rapidly alter cost structures.
For traders, this means not just passively observing fee trends, but actively positioning for volatility, whether by timing blob submissions, adjusting batch sizes, or shifting between DA providers as market conditions evolve. Developers can use this intelligence to optimize rollup economics and user experience.
Looking Ahead: The Future of Blob Costs and Analytics
As Celestia’s ecosystem matures, expect further innovation around blob cost optimization, cross-chain DA arbitrage, and predictive analytics. Real-time monitoring, combined with historical data from Blobscan and Dune, will remain foundational for anyone seeking an edge in blobspace markets. With TIA at $1.01 and DA fees at historic lows, now is the time to refine your analytics stack and trading playbook.
For deeper dives into blob pricing dynamics and best practices for trading Celestia data blobs, explore our guides on informed trading decisions and blobspace market strategies.


No comments yet. Be the first to share your thoughts!