
Celestia’s blobspace is in the spotlight, and for good reason: over the past two weeks, the average blob size has exploded from 1.18 GB to a staggering 11.4 GB. Daily transactions have shot up by more than 60%, now averaging 71,000 per day compared to just 44,000 a few months ago. This dramatic shift is fundamentally reshaping how developers, traders, and data scientists approach Celestia blobspace pricing and market opportunities.
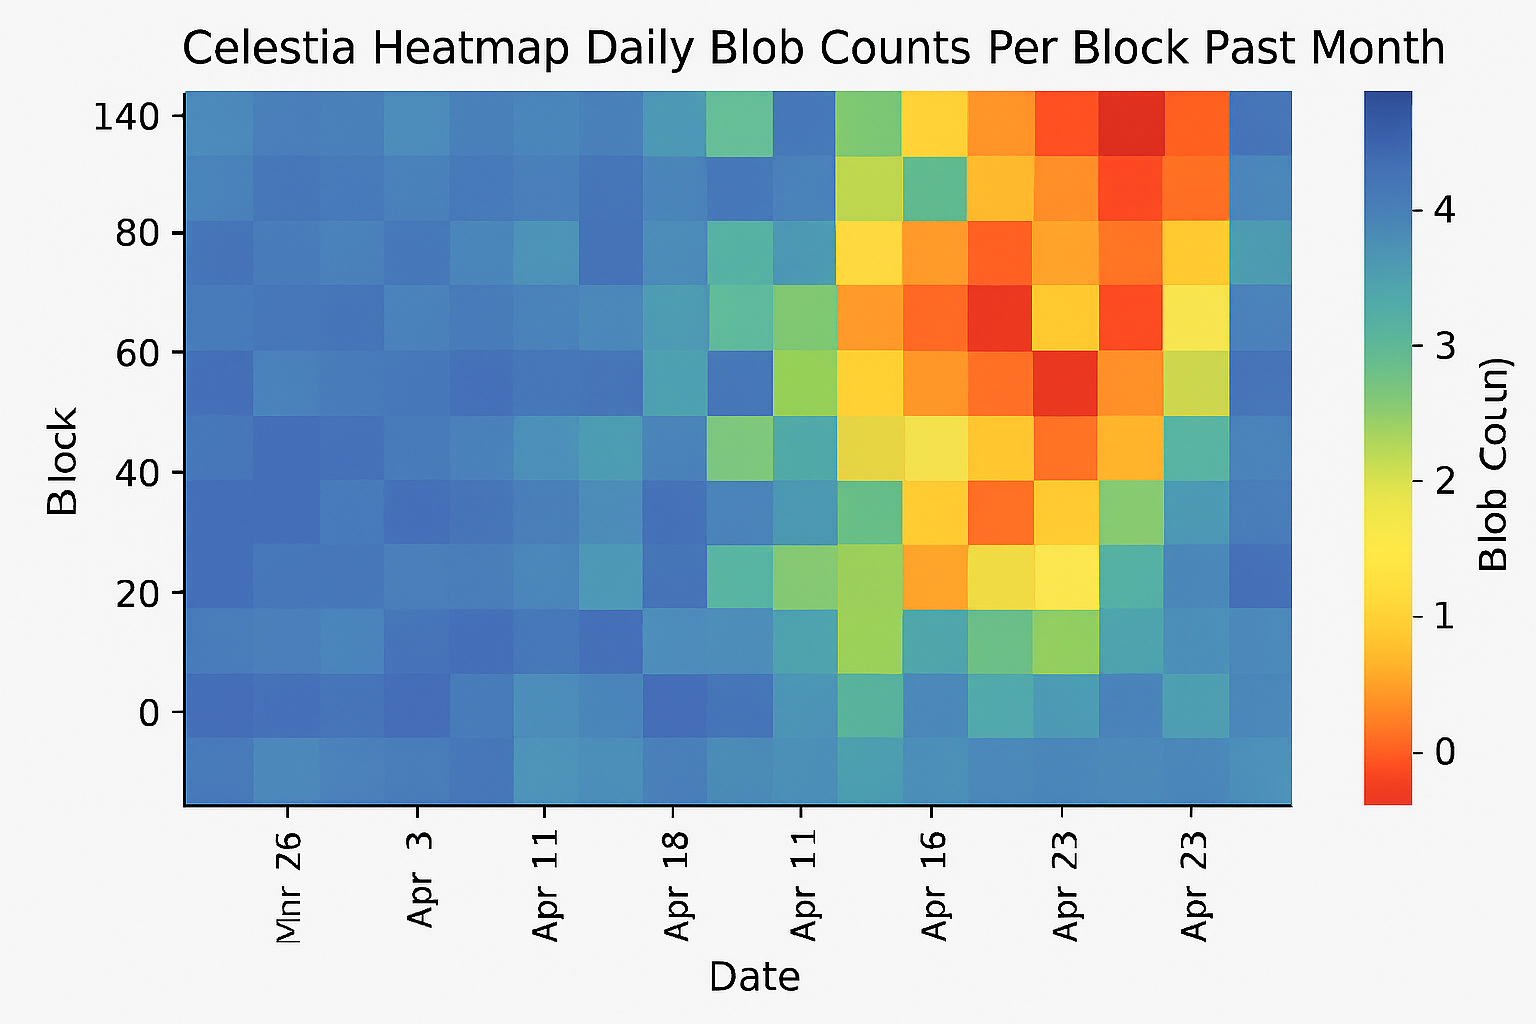
Blob Counts Per Block: The Engine of Blobspace Pricing
The number of blobs included in each Celestia block isn’t just a technical metric - it’s a core driver of cost and opportunity across the ecosystem. As more users submit blobs (think rollups like Eclipse or NFT mints like Mammoth Overlord on Forma), competition for inclusion intensifies. When blocks are packed with blobs approaching the network’s upper limits, users must offer higher fees to ensure their data makes it in.
This dynamic is already playing out in real time. According to The Block, surging NFT activity and Layer 2 adoption have led to larger average blob sizes and higher total blob counts per block. As this demand grows, so does the premium for timely inclusion - especially for projects that can’t afford delays or failed submissions.
Current Market Data: Are We at a Blobspace Tipping Point?
Let’s look at the numbers driving today’s market context:
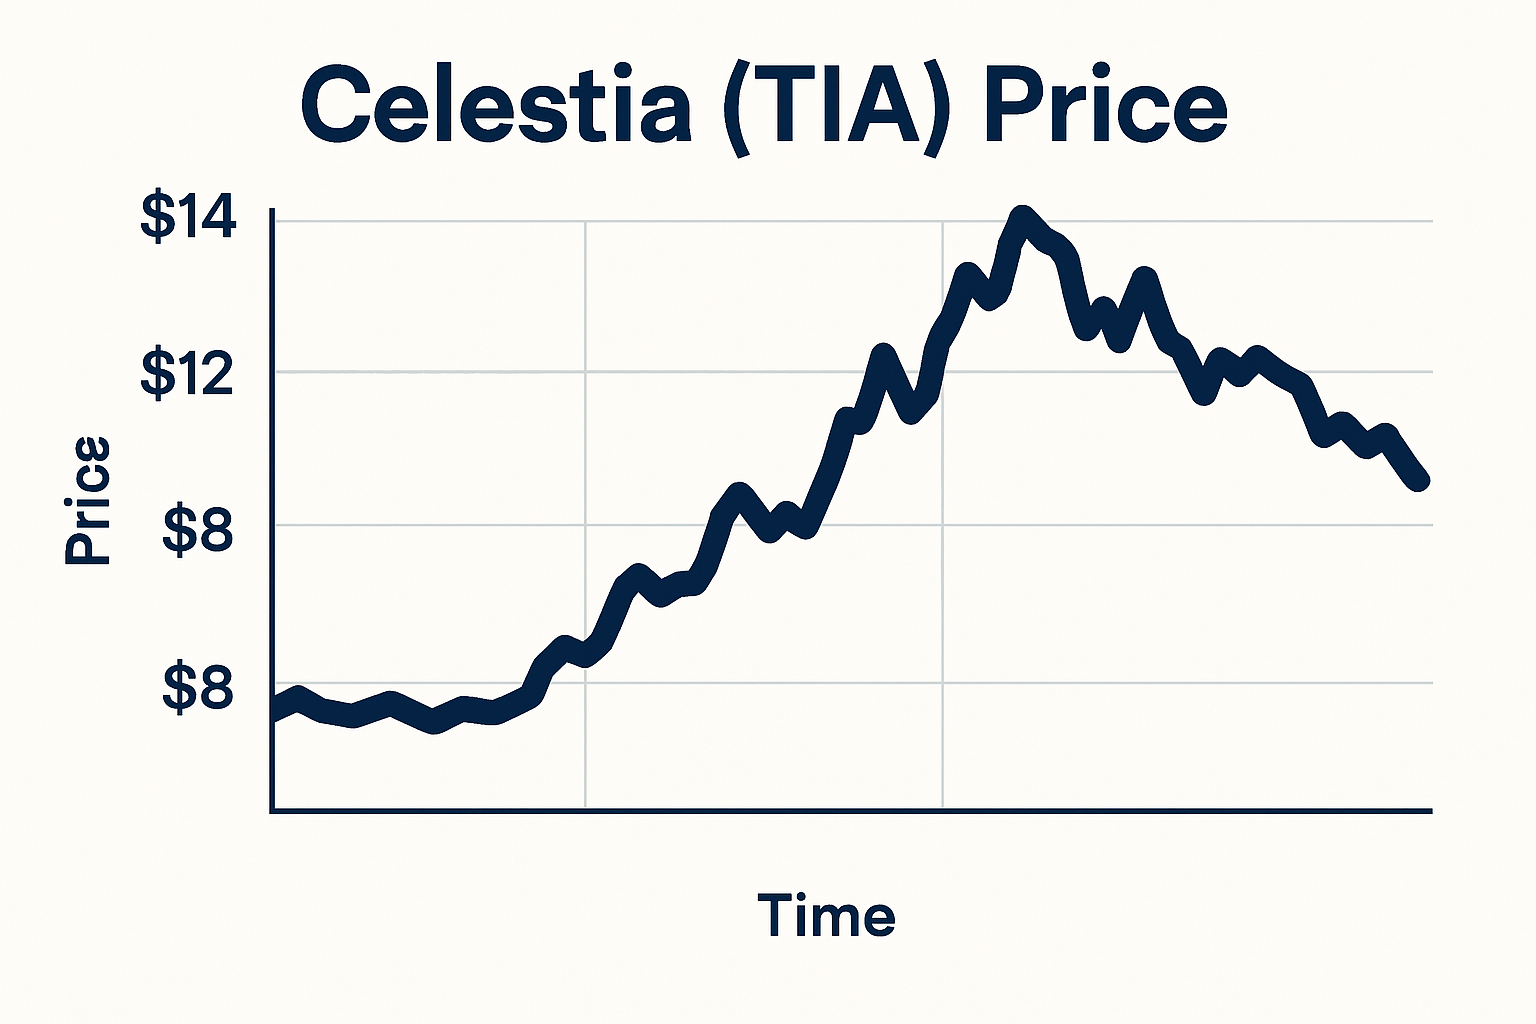
- Celestia (TIA) Price: $1.44 (down 5.26% in the past 24 hours)
- Blob Size Surge: Average jumped from 1.18 GB to 11.4 GB
- Transaction Volume: Up over 60% since June
- Main Contributors: Rollups (Eclipse), NFT mints (Mammoth Overlord/Forma)
This uptick isn’t just noise; it signals a new phase for Celestia as a modular data availability layer. As highlighted by Numia Data, Ethereum L2s and L3s are increasingly leveraging Celestia for high-throughput DA solutions - further fueling demand for scarce blobspace.
Pacing Market Opportunities with Blob Usage Trends
The surge in blob counts per block on Celestia has created fertile ground for both builders and traders eyeing data-driven arbitrage or infrastructure plays. Here’s where things get interesting: as blocks fill up faster, savvy users can monitor real-time blob inclusion rates to predict fee spikes before they hit mainstream dashboards.
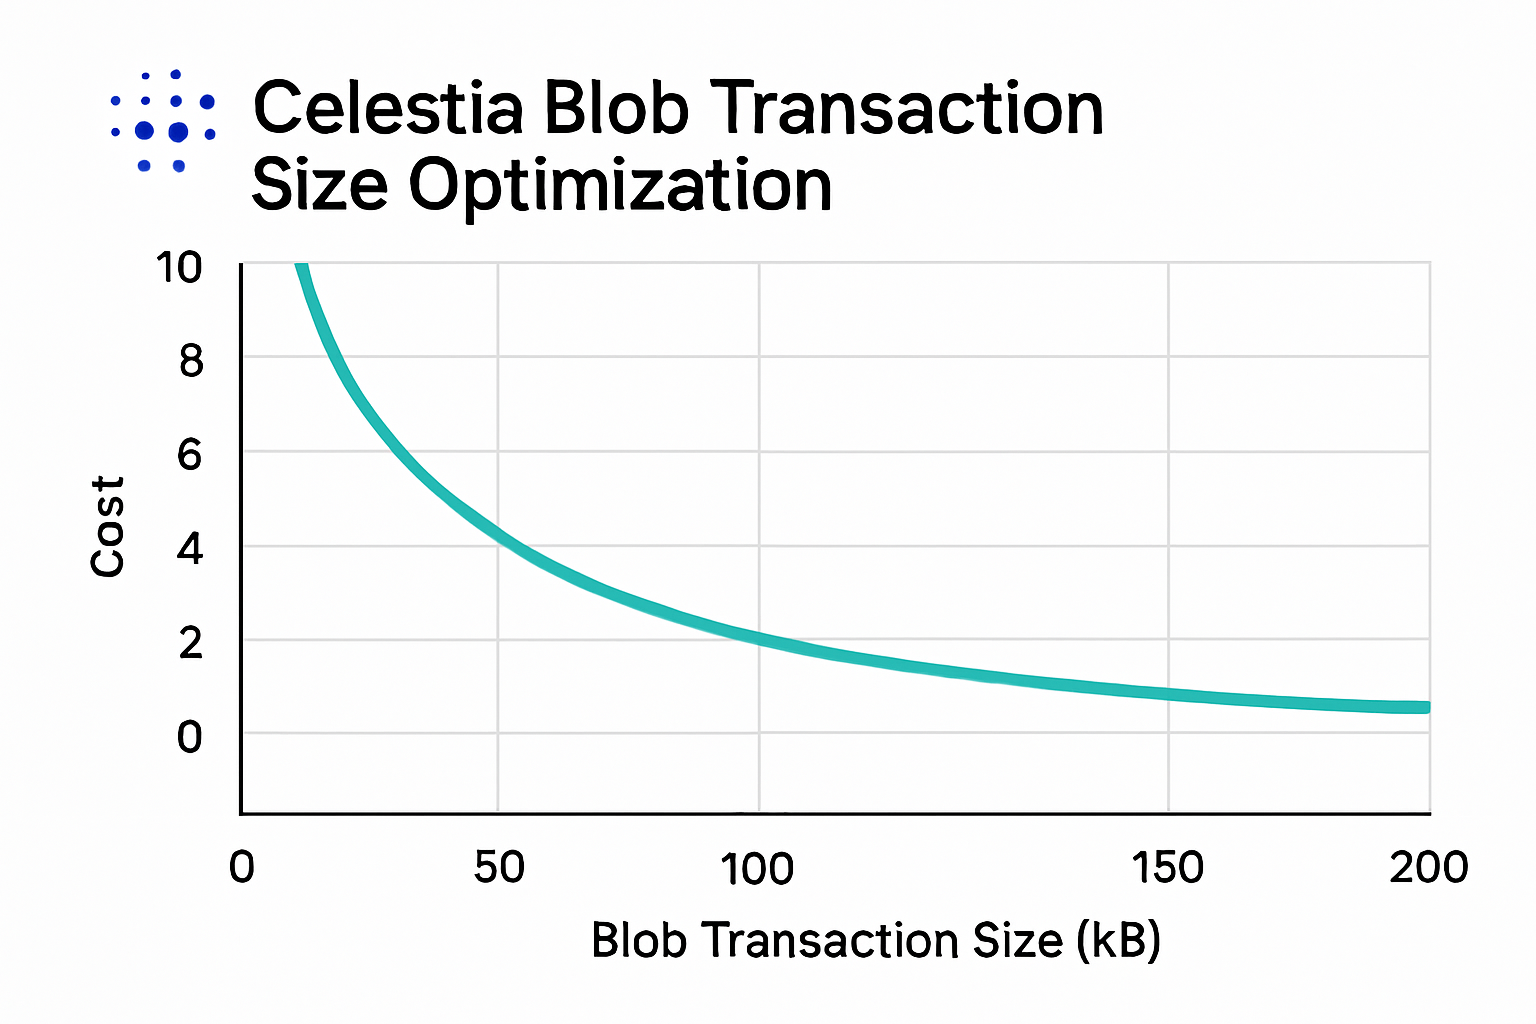
This is especially important given how Celestia’s fee structure works: every transaction pays a flat fee plus a variable component based on total blob size. Keeping blobs under recommended thresholds (well below 1.8 MiB per transaction) can dramatically improve inclusion odds while keeping costs predictable.
Celestia (TIA) Price Prediction 2026-2031
Forecast based on blob count growth, adoption trends, and evolving data availability needs
| Year | Minimum Price | Average Price | Maximum Price | Annual % Change (Avg) | Market Scenario Insights |
|---|---|---|---|---|---|
| 2026 | $1.10 | $1.95 | $3.20 | +35% | Blobspace demand continues; price recovers from volatility, with increasing L2/L3 integrations. |
| 2027 | $1.35 | $2.40 | $4.10 | +23% | Further NFT and rollup adoption; possible fee market spikes; competition from other DA layers emerges. |
| 2028 | $1.60 | $2.95 | $5.00 | +23% | Visa-scale throughput approaches; regulatory clarity improves; rising institutional interest. |
| 2029 | $1.90 | $3.50 | $6.10 | +19% | Scaling upgrades and more rollup traction; TIA as modular money narrative strengthens. |
| 2030 | $2.20 | $4.15 | $7.30 | +19% | Broad DA use beyond Ethereum ecosystem; robust fee market established; possible new use cases. |
| 2031 | $2.60 | $5.00 | $8.80 | +20% | Celestia becomes a staple DA layer; mature ecosystem with stable demand and recurring revenue. |
Price Prediction Summary
Celestia (TIA) is positioned for significant growth as the backbone of modular blockchain data availability. With rising blob counts per block and increasing adoption from Ethereum L2s, NFT projects, and new applications, TIA's price is projected to trend upward over the next six years. While volatility and competition may create short-term fluctuations, long-term fundamentals suggest increasing value as demand for blobspace grows.
Key Factors Affecting Celestia Price
- Blobspace demand growth driven by L2/L3 rollups and NFT activity
- Fee market dynamics as blockspace becomes more competitive
- Technological upgrades (e.g., increased blob capacity, throughput improvements)
- Regulatory developments impacting DA markets and token utility
- Competition from alternative DA solutions (EigenDA, Avail, etc.)
- Macro crypto market cycles and risk sentiment
- Expansion of Celestia's ecosystem and developer adoption
Disclaimer: Cryptocurrency price predictions are speculative and based on current market analysis. Actual prices may vary significantly due to market volatility, regulatory changes, and other factors. Always do your own research before making investment decisions.
The bottom line? Whether you’re developing an L2 solution or trading blobs directly, understanding how rising blob counts per block shape Celestia trading opportunities, pricing strategies, and network congestion will be key to spotting the next big signal before everyone else does.
For data scientists and developers, this is a rare window to capitalize on data blob market analysis. By tracking blob usage trends on Celestia, it’s possible to anticipate periods of heightened demand, when fees spike and inclusion becomes more competitive. The correlation between blob count and fee volatility means that timing your submissions or trades can result in significant cost savings or profit margins.
What’s especially compelling is how modularity compounds these effects. As more Ethereum L2s like Eclipse migrate their data availability needs to Celestia, the network’s role as a neutral DA layer intensifies. This increases not only the overall transaction throughput but also the diversity of actors competing for limited blobspace. NFT projects, DeFi protocols, and gaming applications are all converging on the same resource pool, each with different urgency and willingness to pay.
Strategies for Navigating Blobspace Market Shifts
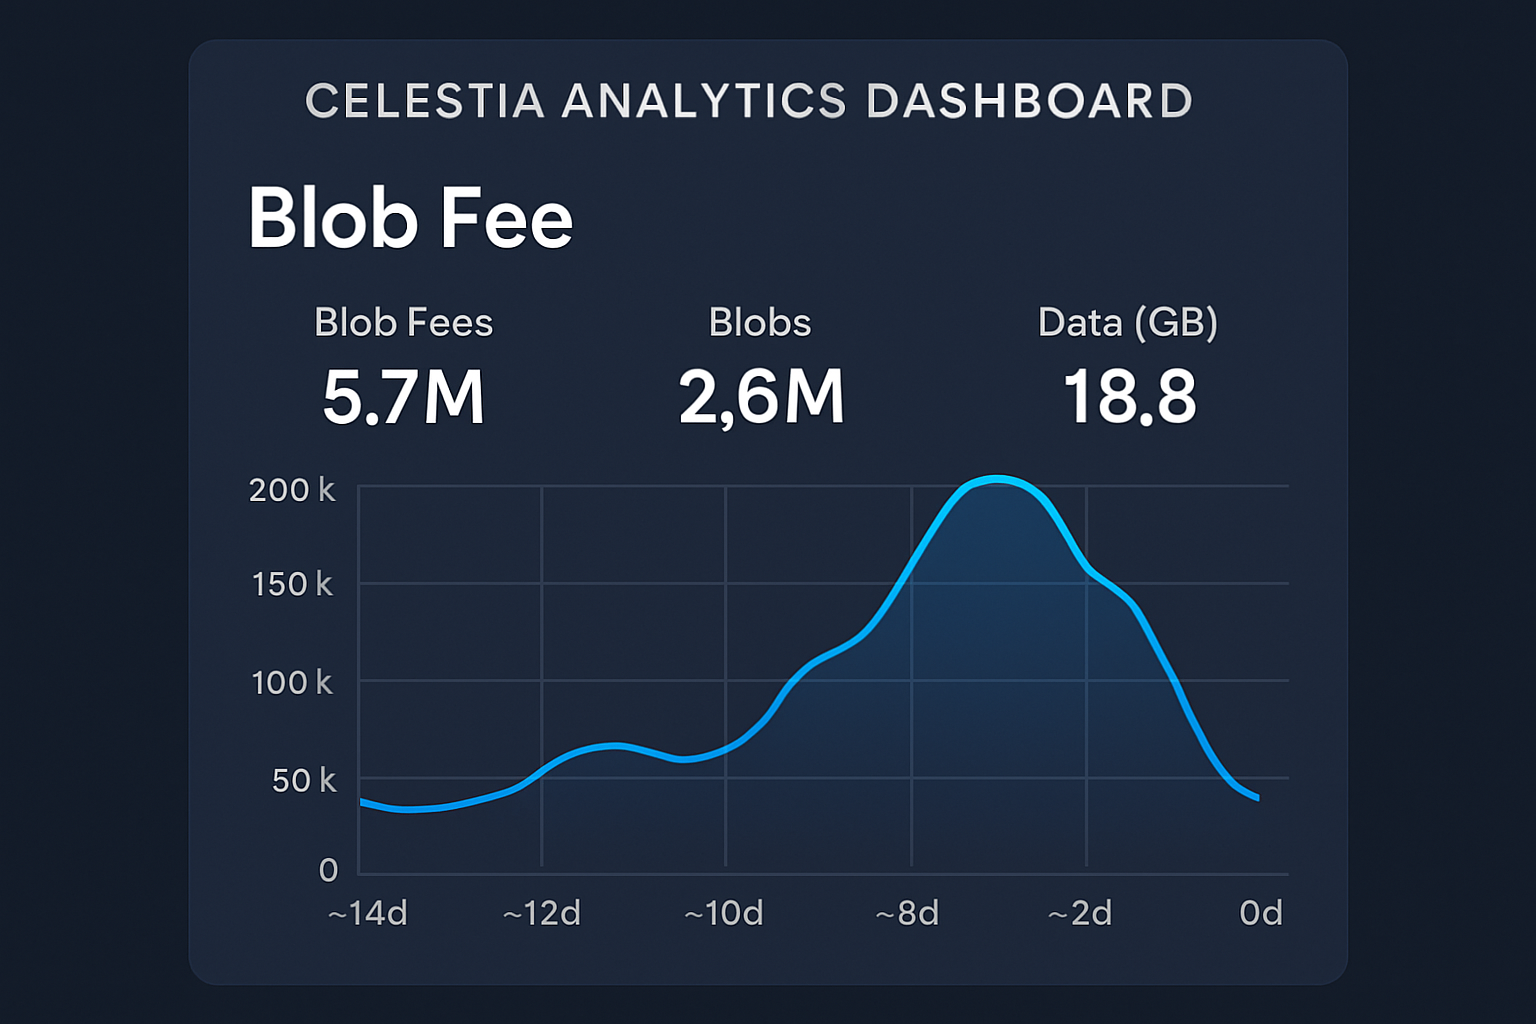
So how can you turn these insights into actionable strategies? Start by monitoring real-time metrics: average blobs per block, median fees, and namespace leaderboard rankings (available via Celestia’s analytics dashboard). These indicators reveal congestion points and help forecast when fee spikes are imminent. Proactive traders can position themselves ahead of these swings, while developers can optimize contract logic to batch or split blobs for more efficient inclusion.
Top 5 Strategies to Optimize Celestia Blobspace Costs
- 1. Right-Size Your Blobs for Efficient Inclusion: Keep blob sizes well below the 1.8 MiB threshold per transaction to maximize inclusion probability and minimize fees. This is crucial as Celestia’s recent surge to 11.4 GB average daily blob size has intensified competition for blockspace.
- 2. Monitor Real-Time Blobspace Fees Using Celestia’s Analytics Dashboard: Leverage the Celestia: Overview - Analytics Dashboard to track median blob costs, fee trends, and top namespaces. This data-driven approach helps you time your submissions for lower costs.
- 3. Batch Transactions and Use Compression Where Possible: For projects like NFT mints (e.g., Mammoth Overlord NFTs on Forma), batching multiple data points into a single blob and applying data compression can significantly reduce per-transaction costs.
- 4. Integrate with High-Throughput L2s Leveraging Celestia: Consider deploying on established Layer 2s like Eclipse, which utilize Celestia’s data availability layer. This can help distribute costs and take advantage of scaling solutions as daily transactions rise (now averaging 71,000 per day).
- 5. Actively Track TIA Price Movements for Cost Planning: With Celestia (TIA) currently at $1.44 (down 5.26% in 24h), regularly monitor TIA’s price via reputable sources. This helps you anticipate fee fluctuations and optimize the timing of large data submissions.
It’s also worth noting that as blob sizes surge: now averaging 11.4 GB per day, the total value flowing through Celestia is growing rapidly. With TIA trading at $1.44, even a modest increase in transaction volume translates into meaningful revenue for validators and token holders alike. This reflexive loop between usage, fees, and token value is what makes Celestia such an asymmetric bet right now.
The path forward will likely see continued innovation around fee markets (think dynamic pricing algorithms) and scaling solutions (such as expanding maximum blobs per block). For now, those who stay closest to the data, and adapt their strategies as new patterns emerge, will be best positioned to unlock outsized returns in this fast-evolving ecosystem.
Spot the signal before the noise: Watch block-level blob metrics closely, leverage analytics dashboards, and don’t be afraid to experiment with new fee optimization tactics as network conditions evolve.


No comments yet. Be the first to share your thoughts!