
Celestia Data Blob Trading Volume Spikes: Analyzing ETH Price Correlations in Blobspace Markets

Picture this: Celestia’s data blob sizes exploding nearly tenfold in just weeks, from a steady 1.18 GB average to a whopping 11.4 GB daily. Transactions? Up over 60% to 71,000 per day. And the native TIA token? It’s jumped 19% in the last 24 hours on trading volume that ballooned 4.4 times to $301.7 million. This isn’t just hype; it’s a seismic shift in the Blobspace Markets, where Celestia data blobs trading is suddenly the hottest ticket. But as volumes spike, traders are eyeing potential ripples into Ethereum’s realm, especially with ETH holding at $2,674.95 after a 2.24% dip.
At Blobspace Markets, we’re laser-focused on these trends, helping you spot opportunities in Celestia’s burgeoning ecosystem. This surge screams adoption, fueled by NFT mints like Mammoth Overlord on Forma and RARI chain integrations. Yet, the big question lingers: does this blob trading volume ETH correlation hold water, or is it more coincidence than causation?
Blob Volumes Skyrocket: Visualizing the 10x Surge
Imagine a chart where the line for daily Celestia blob sizes shoots straight up like a rocket. That’s the scene on The Block’s dashboard right now. Back between June and December 2024, we hovered around 1.18 GB. Fast forward to these past two weeks, and boom: 11.4 GB average. It’s visual poetry for data availability hunger.
Why the frenzy? Projects are flocking to Celestia as their go-to layer for posting blobs, dodging Ethereum’s pricier options. Daily transactions hitting 71,000 mark real demand, not fluff. NFT activity is the spark, Mammoth Overlord drops and RARI’s rollup magic are packing namespaces tight. Check Celestia’s Blob Data Leaderboard on Blockworks; top spots are buzzing with volume, fees climbing, median costs per blob telling a story of efficiency.
This growth underscores Celestia’s readiness for scale, outpacing even optimistic rollup forecasts.
In my view, this isn’t a blip. It’s the ecosystem maturing, with Fibre Blockspace on the horizon promising 1Tb/s across 500 nodes. Traders on Blobspace Markets, take note: Celestia blob pricing trends are shifting fast.


Celestia’s Cost Edge Over ETH Blobs: Numbers Don’t Lie
Let’s break it down visually: Ethereum blobs at $20.56 per MB versus Celestia’s $7.31, a 64% savings, per Conduit data across full rollup usage periods. That’s not pocket change; it’s game-changing for L2s and high-volume projects.
Take Eclipse: 83 GB of data would’ve drained over $300,000 on Ethereum blobs. On Celestia? Roughly $6,000. That’s a 50x efficiency win, spotlighting Celestia’s competitive moat in data availability. No wonder blob sizes are spiking; cost-conscious builders are voting with their bytes.
| Metric | Ethereum Blobs | Celestia Blobs |
|---|---|---|
| Cost per MB | $20.56 | $7.31 |
| Savings | – | 64% |
| Eclipse 83 GB Example | $300,000 and | ~$6,000 |
This table paints the picture clearly. As Ethereum grapples with EIP-4844’s blob conundrum, balancing L2 scalability against ETH value accrual, Celestia swoops in with cheaper, scalable blockspace. Blobspace Markets analytics capture this live, letting you track data blob market spikes in real-time.
Opinion time: Ethereum’s target demand paradox, pegged at 6.57-6.72 blobs effective demand, hints at fee market pressures ahead. Celestia’s surge could amplify that, indirectly nudging ETH dynamics at its current $2,674.95 perch.
TIA Token Ignites: Volume Surge Meets Price Action
TIA’s not sleeping on this. From a reset near $0.60, it’s roared 19% higher, with 48,424 daily transactions, the peak since August. Trading volume at $301.7 million tells of fresh capital piling in, mirroring blob frenzy.
At Blobspace Markets, we see this as classic supply-demand visuals: more blobs, higher utility, TIA demand follows. Long-term forecasts tie TIA’s path to rollup market share capture, potentially massive through 2030.
Celestia (TIA) Price Prediction 2027-2032
Long-term forecast based on rollup market capture, surging blob volumes, and data availability adoption from 2026 baseline (~$1.80 avg)
| Year | Minimum Price | Average Price | Maximum Price | YoY % Change (Avg from Prior) |
|---|---|---|---|---|
| 2027 | $2.50 | $7.50 | $18.00 | +317% |
| 2028 | $3.00 | $12.00 | $30.00 | +60% |
| 2029 | $5.00 | $20.00 | $50.00 | +67% |
| 2030 | $8.00 | $32.00 | $75.00 | +60% |
| 2031 | $12.00 | $45.00 | $100.00 | +41% |
| 2032 | $18.00 | $65.00 | $150.00 | +44% |
Price Prediction Summary
Celestia (TIA) is positioned for substantial long-term growth, driven by 10x blob size surges, 60%+ cheaper DA vs. ETH, and rollup/NFT adoption. Bullish max targets $150 by 2032 in high-adoption scenarios; min floors reflect bear markets and competition.
Key Factors Affecting Celestia Price
- Surging blob volumes (11.4 GB avg daily) and 60% tx growth from NFTs/rollups
- 64% cost advantage over ETH blobs ($7.31 vs $20.56 per MB)
- Fibre protocol enabling 1Tb/s blockspace scalability
- Crypto market cycles with BTC/ETH correlations
- Regulatory clarity for modular DA layers
- Competition from ETH blob improvements and target demand dynamics
- Overall rollup market expansion per CryptoRank forecasts
Disclaimer: Cryptocurrency price predictions are speculative and based on current market analysis.
Actual prices may vary significantly due to market volatility, regulatory changes, and other factors.
Always do your own research before making investment decisions.
But here’s the nuanced take, while volumes spike, direct ties to ETH’s $2,674.95 price remain elusive. Multiple factors drive both: macro sentiment, L2 growth, DA competition. Still, Celestia’s momentum exerts subtle pressure on Ethereum’s blob economics, worth watching closely via our real-time tools.
Traders peering at Blobspace Markets analytics charts might spot faint echoes between these spikes and ETH’s steadiness at $2,674.95, but let’s dissect it properly. No smoking gun links Celestia’s blob boom directly to ETH price swings; broader crypto tides like L2 adoption and macro flows pull both strings. Still, Celestia’s cost edge nibbles at Ethereum’s blob market share, potentially easing ETH fee pressures long-term while spotlighting TIA as the purer DA play.
Decoding the Correlation: Blobs, TIA, and ETH at $2,674.95
Visualize two lines on a scatter plot: Celestia’s daily blob sizes rocketing to 11.4 GB alongside TIA’s volume explosion to $301.7 million, while ETH dips 2.24% to $2,674.95. Correlation coefficient? Likely near zero on raw data. Ethereum’s blob fee market wrestles its own paradoxes, with effective demand hovering at 6.57-6.72 blobs per EIP research, flirting with target utilization caps. Celestia’s surge siphons some load, but ETH holders aren’t sweating it yet; blobs were designed for cheap L2 data, not ETH revenue rocket fuel.
My take: indirect threads weave tighter. As rollups balloon, Celestia’s 64% cheaper DA ($7.31/MB vs. $20.56) lures projects, freeing Ethereum capacity and stabilizing its $2,674.95 price amid volatility. Blobspace Markets overlays these metrics seamlessly, revealing blob trading volume ETH correlation nuances through layered charts. Watch namespaces on the leaderboard; high-volume leaders signal where capital flows next.
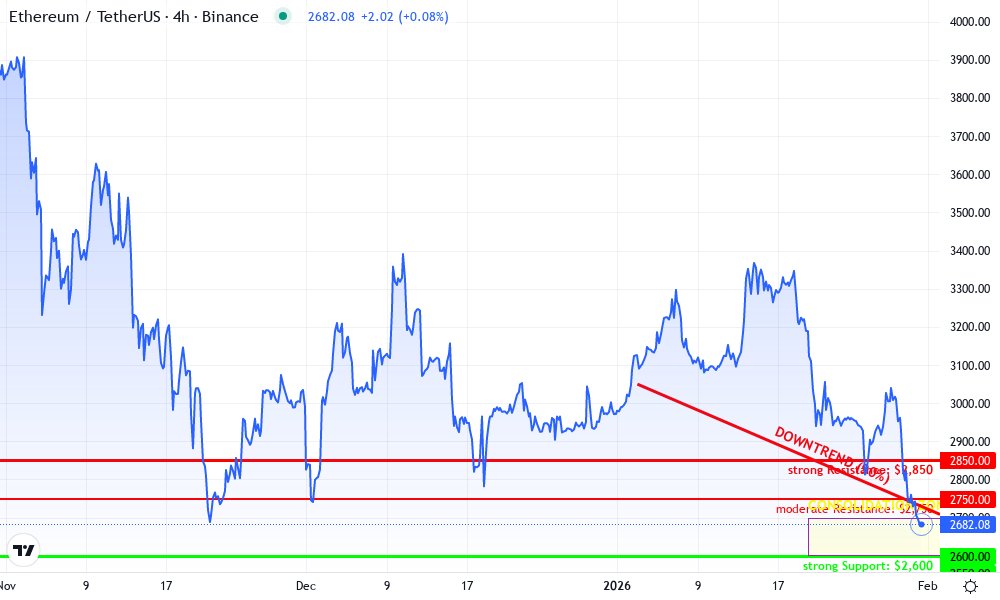
Ethereum Technical Analysis Chart
Analysis by Lila Whitmore | Symbol: BINANCE:ETHUSDT | Interval: 4h | Drawings: 6
Technical Analysis Summary
To visualize this ETHUSDT chart in my signature style, start by drawing a prominent downtrend line connecting the January 2026 high around 3050 to the recent lows near 2620, using a thick red trend_line to ‘connect the dots’ on the bearish impulse. Add horizontal_lines at key support (2600, strong) and resistance (2750, 2850). Overlay a rectangle for the late January consolidation zone between 2600-2700 from 2026-01-20 to 2026-02-05. Use fib_retracement from the Dec-Jan swing high to low for potential retracement levels. Mark volume spikes with callout on downside bars, and add arrow_mark_up for the minor bounce from 2550. Place text notes like ‘Watch 2600 support’ and my motto ‘Connect the dots, see the trend.’ Finally, arrow_mark_down on MACD bearish signal.
Risk Assessment: medium
Analysis: High volatility from Celestia competition context, downtrend intact but support holding; aligns with my medium tolerance for swing setups
Lila Whitmore’s Recommendation: Hold off on longs until 2750 break with volume—scale in shorts if 2600 fails. Connect the dots patiently.
Key Support & Resistance Levels
📈 Support Levels:
-
$2,600 – Cluster of recent lows, aligns with 24h low extension
strong -
$2,550 – Late Jan swing low, volume shelf
moderate
📉 Resistance Levels:
-
$2,750 – Recent swing high, 24h high zone
moderate -
$2,850 – Mid-Jan breakdown level, prior consolidation top
strong
Trading Zones (medium risk tolerance)
🎯 Entry Zones:
-
$2,680 – Break above current price on volume, confirming bounce from 2600 support
medium risk
🚪 Exit Zones:
-
$2,850 – Resistance test, fib 50% retracement
💰 profit target -
$2,600 – Invalidation below key support
🛡️ stop loss
Technical Indicators Analysis
📊 Volume Analysis:
Pattern: spikes on downside, drying up on bounce
Bearish volume profile—higher volume on declines, low on recovery signals weak bulls
📈 MACD Analysis:
Signal: bearish divergence, histogram contracting negatively
MACD line below signal with fading momentum, no bullish crossover yet
Applied TradingView Drawing Utilities
This chart analysis utilizes the following professional drawing tools:
Disclaimer: This technical analysis by Lila Whitmore is for educational purposes only and should not be considered as financial advice.
Trading involves risk, and you should always do your own research before making investment decisions.
Past performance does not guarantee future results. The analysis reflects the author’s personal methodology and risk tolerance (medium).
That said, TIA’s 19% leap on 48,424 transactions screams ecosystem heat. If Fibre’s 1Tb/s blockspace lands, Celestia could dominate DA, pressuring ETH blobs further. Traders, connect these dots early via our platform.
Leaderboard Leaders: Where Blob Volume Concentrates
Blockworks’ Blob Data Leaderboard reads like a heat map of opportunity. Top namespaces pulse with fees and volumes, median blob costs dipping as scale kicks in. NFT mints dominate, but rollups lurk beneath, eyeing Celestia’s efficiency for 2025 surges.
| Namespace Rank | Volume (GB) | Fees ($) | Median Cost/Blob |
|---|---|---|---|
| 1 (e. g. , Mammoth) | High | Rising | Low |
| 2 (RARI-related) | Medium-High | Steady | Efficient |
| 3-5 | Growing | Climbing | Competitive |
This snapshot, pulled from live dashboards, underscores concentration risks and alpha spots. Diversify across leaders on Blobspace Markets to ride data blob market spikes safely.
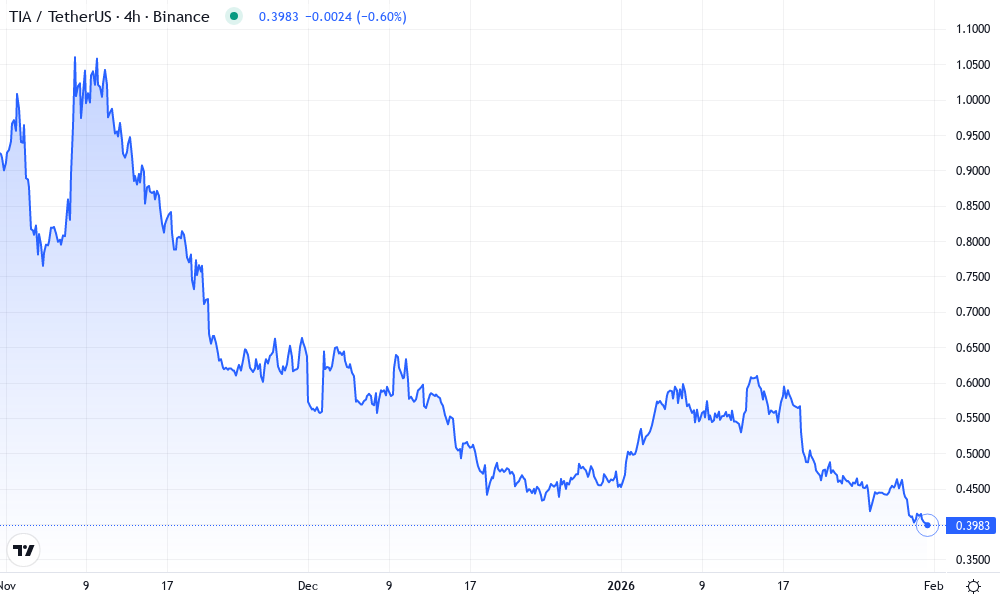
Celestia Technical Analysis Chart
Analysis by Lila Whitmore | Symbol: BINANCE:TIAUSDT | Interval: 4h | Drawings: 6
Technical Analysis Summary
To visualize this Celestia chart in my signature style, start by connecting the dots on the dominant downtrend: draw a steep trend_line from the January 9, 2026 high around 3.2 to the February 17, 2026 low at 2.4, highlighting the bearish momentum post-December peak. Add a shorter-term uptrend line from January 9 low at 2.5 to January 17 peak at 3.5 for the brief counter-trend bounce. Mark key support at 2.50 with a strong horizontal_line and resistance at 3.20 (moderate) and 4.50 (strong) using horizontal_lines. Rectangle the consolidation zone from January 9-17 between 2.5-3.5. Use arrow_mark_down at the January breakdown from 3.5. Callout volume spikes on the drops with ‘High volume sell-off’. Text overlay: ‘Bearish but blob fundamentals building – watch 2.50 support’. Fib_retracement from Dec high (ignore date) to Jan low for potential retrace levels. Overall, visually link price action to on-chain blob surge for hybrid view.
Risk Assessment: medium
Analysis: Bearish technical structure but strong fundamentals from blob surge and cost advantages vs ETH; medium tolerance suits swing long on support hold
Lila Whitmore’s Recommendation: Hold for 2.50 test, enter long on confirmation – connect dots between chart and on-chain!
Key Support & Resistance Levels
📈 Support Levels:
-
$2.5 – Strong multi-touch low in Jan-Feb, aligns with recent chart bottom and psychological level
strong -
$2.8 – Moderate interim support from late Jan bounces
moderate
📉 Resistance Levels:
-
$3.2 – Recent Jan high, failed breakout point
moderate -
$4.5 – Key Dec-Jan swing low turned resistance, high volume rejection zone
strong
Trading Zones (medium risk tolerance)
🎯 Entry Zones:
-
$2.55 – Bounce off strong 2.50 support with increasing volume and blob fundamental tailwinds
medium risk -
$2.95 – Break above minor resistance for confirmation of uptrend resumption
low risk
🚪 Exit Zones:
-
$3.5 – Profit target at recent high retest
💰 profit target -
$2.4 – Tight stop below key support to limit downside
🛡️ stop loss
Technical Indicators Analysis
📊 Volume Analysis:
Pattern: High volume on breakdowns, drying up on bounces
Volume spikes confirm sell-offs in Jan downmove, lower volume on recovery suggests weakening bears
📈 MACD Analysis:
Signal: Bearish divergence and crossover in Jan
MACD line below signal with histogram contracting, but potential bullish divergence emerging at lows
Applied TradingView Drawing Utilities
This chart analysis utilizes the following professional drawing tools:
Disclaimer: This technical analysis by Lila Whitmore is for educational purposes only and should not be considered as financial advice.
Trading involves risk, and you should always do your own research before making investment decisions.
Past performance does not guarantee future results. The analysis reflects the author’s personal methodology and risk tolerance (medium).
Ethereum’s blob balancing act continues, per Blockworks debates: scalability wins for L2s, but does it dilute ETH at $2,674.95? Celestia sidesteps that, capturing pure DA value accrual. Eclipse’s $6,000 vs. $300,000 win exemplifies why builders switch, inflating blob trading volumes.
For hands-on traders, Blobspace Markets turns this chaos into clarity. Overlay blob pricing trends with ETH’s $2,674.95 movements, backtest strategies during capacity crunches, and position ahead of Fibre. As DA wars heat up, Celestia’s edge sharpens Ethereum blob limits’ ripple effects. Spot the namespaces swelling first, scale in on dips, and let visuals guide your edge. The trend? Crystalizing now.