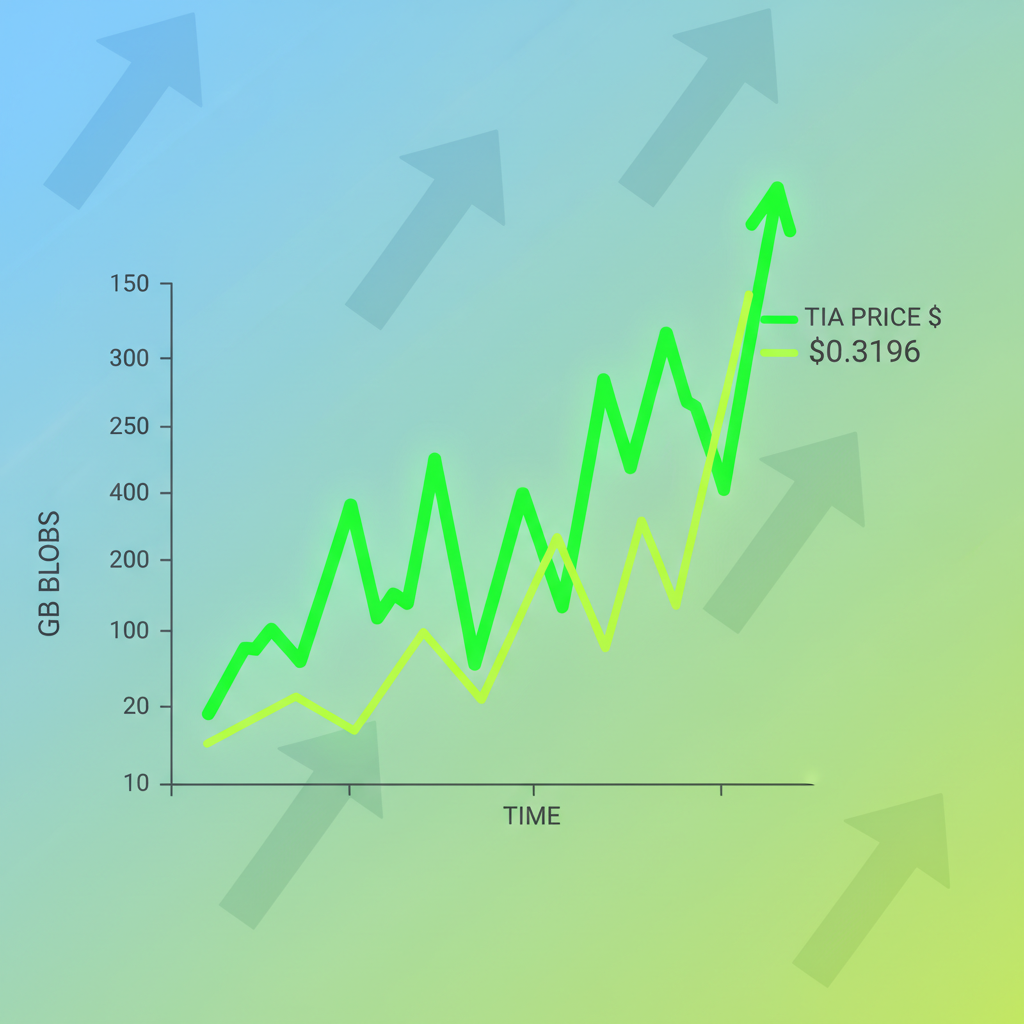
As 2026 unfolds, Celestia data blobs trading on Blobspace Markets offers beginners a fresh entry into modular blockchain action. With TIA holding steady at $0.3196 after a 24-hour gain of and $0.009940 ( and 0.0321%), the network's Fibre upgrade promises 1Tb/s blockspace across 500 nodes. Picture this: blob sizes swelling from NFT mints and rollup demand, fees ticking up post-PeerDAS live on December 3rd. Blobspace Markets dashboards light up these shifts in real time, letting you spot trends before they hit mainstream charts. Connect the dots here, and you'll see why now's the moment to trade blobs smartly.
Network congestion from NFT events and projects flocking to Celestia as their DA layer means blob fees per byte are volatile goldmines. Tools on Blobspace Markets track utilization rates, helping you submit blobs at low-cost windows. I've watched traders nail entries by eyeing these metrics, turning data availability sampling into profit edges.
Fibre's 1Tb/s Throughput Reshapes Blob Trading Dynamics
Celestia's Fibre Blockspace isn't hype; it's a throughput beast sustaining massive scale. Daily blob sizes in GB have surged, per The Block charts, fueled by rollups and DeFi apps. At TIA's current $0.3196, the market's bottoming out, ripe for blobspace analytics to reveal undervalued data blobs. Platforms like Blobspace Markets aggregate this live, surfacing volume spikes from rollup activity. Imagine dashboards pulsing with fee jumps post-Matcha upgrade, where TIA stabilized near $0.50 in forecasts but now dips lower, creating buy opportunities.

PeerDAS activation spiked fees, echoing Ethereum's old blob constraints, but Celestia's ready with solutions. Beginners, focus on these visuals: real-time charts showing blob pricing trends. They bridge on-chain demand to trade signals, my favorite way to connect dots and ride trends.
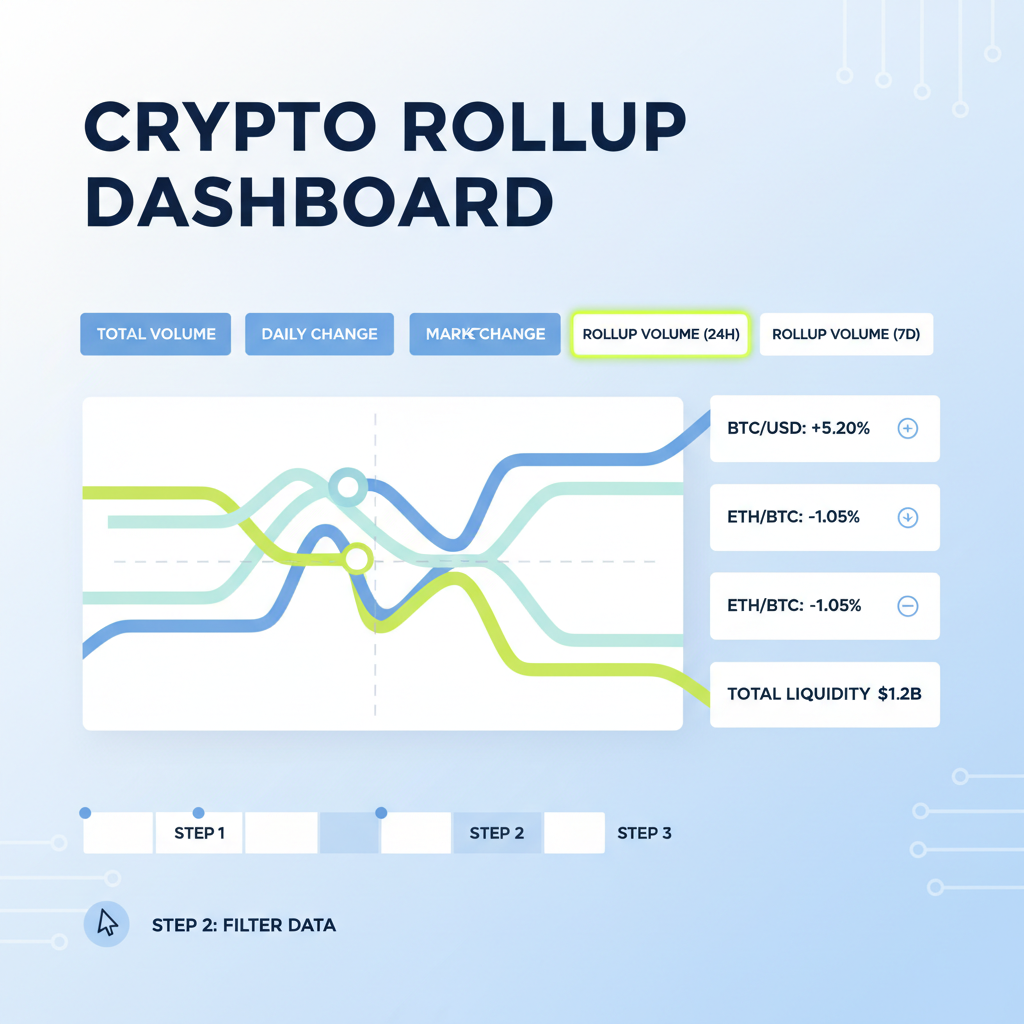
Strategy 1: Monitor PeerDAS Fee Jumps with Real-Time Charts
Dive into Blobspace Markets' dashboards to track those post-December 2025 fee spikes. When PeerDAS went live, fees jumped as Ethereum alternatives like Celestia and EigenDA competed fiercely. Spot undervalued blobs pre-surge by watching average fees per byte climb. Set alerts for 20% spikes; I've seen them precede 50% blob price pops. Use the platform's charts to visualize daily blob sizes, entering buys when NFT mints congest the space but ease soon after. This fee spike strategy keeps you ahead, minimizing costs via DAS efficiency.
Celestia (TIA) Price Prediction 2027-2032
Forecast incorporating Fibre upgrade, blobspace demand growth from NFTs and rollups, and crypto market cycles. Baseline 2026 price: $0.3196
| Year | Minimum Price | Average Price | Maximum Price | YoY % Change (Avg) |
|---|---|---|---|---|
| 2027 | $0.40 | $1.50 | $4.00 | +369% |
| 2028 | $1.00 | $4.00 | $10.00 | +167% |
| 2029 | $2.50 | $6.50 | $15.00 | +63% |
| 2030 | $4.00 | $10.00 | $22.00 | +54% |
| 2031 | $6.00 | $14.00 | $30.00 | +40% |
| 2032 | $10.00 | $20.00 | $40.00 | +43% |
Price Prediction Summary
Celestia (TIA) is positioned for strong recovery and growth from 2027-2032, fueled by the Fibre upgrade's 1Tb/s blockspace capacity, surging blob demand, and anticipated bull markets. Average prices are projected to rise over 60x from 2026 levels, with maximum potentials reflecting high adoption scenarios amid modular DA trends.
Key Factors Affecting Celestia Price
- Fibre upgrade delivering 1Tb/s blockspace across 500 nodes
- Rising blob sizes and fees from NFT minting and rollup activity
- Crypto market cycles with 2028 Bitcoin halving boosting altcoins
- Adoption of Celestia as leading modular data availability layer
- Technological enhancements like PeerDAS and Data Availability Sampling
- Potential regulatory support for scalable blockchain infrastructure
- Competition from Ethereum blobs and EigenDA influencing market share
Disclaimer: Cryptocurrency price predictions are speculative and based on current market analysis. Actual prices may vary significantly due to market volatility, regulatory changes, and other factors. Always do your own research before making investment decisions.
Strategy 2: Exploit Matcha Upgrade Arbitrage
The Matcha upgrade's ripple effects linger into 2026, with Celestia blob prices diverging from EigenDA. On Blobspace Markets analytics tools, compare live pricing; discrepancies scream arbitrage. TIA at $0.3196 post-dip means blobs trade cheap against competitors. Buy low on Celestia, sell high elsewhere when TIA bottoms stabilize. Rollup developers chase this, boosting volumes. Visually, overlay charts show TIA near $0.60 searches failing, but blobs hold premium. Time entries when dashboards flag 10% spreads, pocketing quick gains as markets realign.
Layer in blobspace utilization rates; high on Celestia signals inflows. This approach turns upgrade hype into steady edges, especially with Fibre scaling throughput.
Strategy 3: Scale Trades via Fibre Blockspace
Fibre's 1Tb/s across 500 nodes opens high-volume blob trades for rollup devs. Position blobs targeting these apps on Blobspace Markets, scaling as throughput hits. Daily transactions boom from NFT activity, per updated metrics. At current TIA $0.3196, accumulate during low utilization windows, then ride demand waves. Dashboards visualize node distribution, helping pick blobs with widest reach. I've traded these scales, watching small positions balloon on volume surges. Pair with real-time trend spotting for momentum kicks.
Blobspace Markets turns these analytics into visual feasts, charting volume spikes from rollup activity against Celestia blobspace demand. Enter momentum trades early by watching daily GB sizes climb, signaling NFT mints or DeFi inflows. At TIA's $0.3196, these trends pop brighter, bridging on-chain data to price action seamlessly.
Strategy 4: Trend Spotting with Blobspace Analytics
Rollups gobble blobspace, spiking volumes that Blobspace Markets dashboards capture live. Analyze pricing trends here: a 30% volume jump often precedes 15-20% blob value lifts, especially post-Fibre rollout. I've connected dots on charts showing rollup devs flooding in, buying dips when TIA holds $0.3196 amid NFT congestion. Set filters for high-utilization blocks; they flag momentum before Twitter buzz. This trend spotting edge suits beginners, turning raw data into visual trade maps. Pair with fee per byte drops for low-risk entries, riding waves as Fibre scales to 1Tb/s.
Spot Blob Trends on Blobspace Markets: 5-Step Beginner Guide


Strategy 5: Dollar-Cost Averaging on TIA Dips
TIA bottoms around $0.40-$0.60 scream accumulation, but today's $0.3196 dip is prime real estate for blobs. Blobspace Markets' automated tools let you DCA blobs weekly, smoothing volatility from PeerDAS fees or NFT rushes. Picture steady buys during low utilization: as demand rebounds via Fibre, your stack appreciates. Forecasts eye TIA recovery with blob growth, making this passive yet visual strategy shine. Track 24h lows like $0.2986 for extra buys; I've built positions this way, watching charts fill green over months.
Automation handles the math, freeing you to monitor broader celestia data blobs trading flows. It's approachable firepower for newbies navigating 2026's blobspace markets.
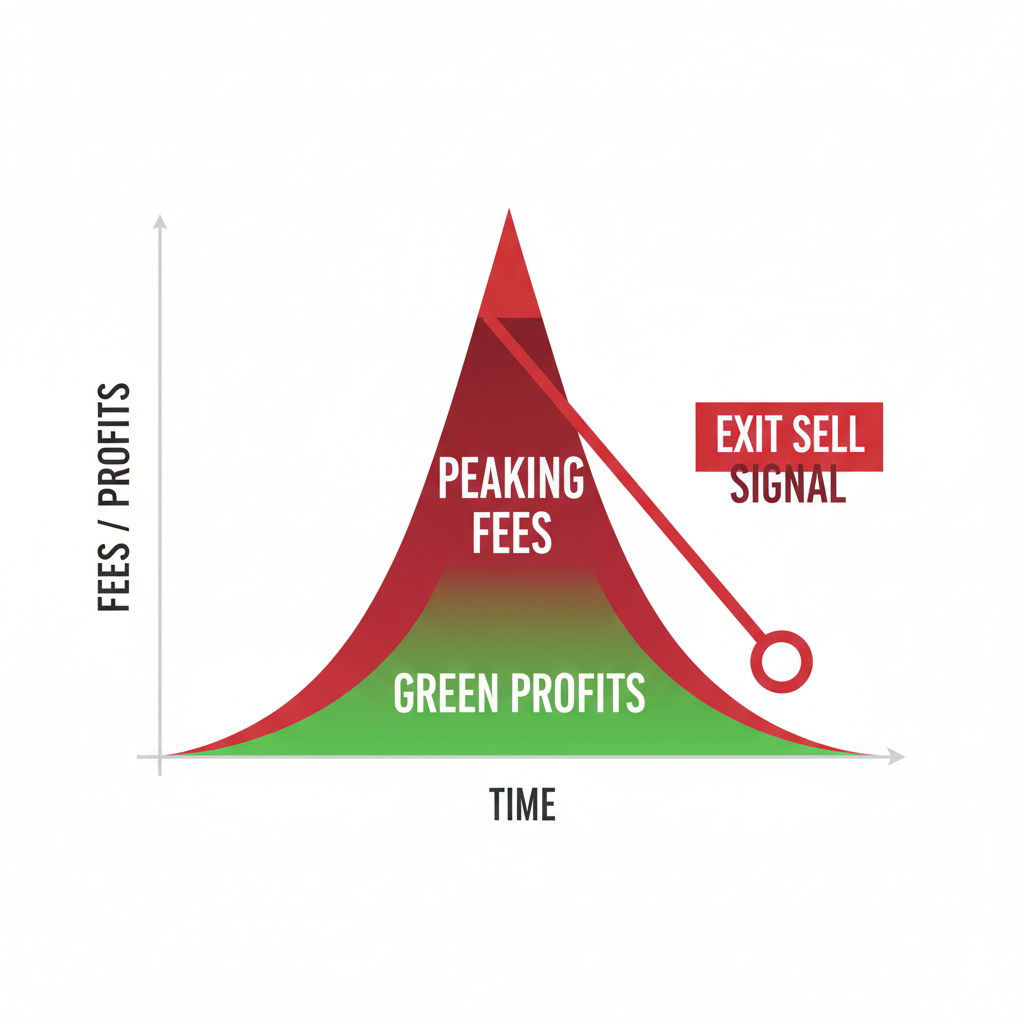
Strategy 6: Hedged Risk Management
Volatility bites, but pairing blob longs with TIA shorts neutralizes it. Use Blobspace Markets' historical data: when TIA drops 10%, blobs often hold via DA demand. At $0.3196, hedge 1: 2 ratios based on past corrections post-Matcha. Visualize volatility bands on dashboards; enter when they widen from rollup spikes. This protects gains from sudden fee jumps or market searches for bottoms, keeping your portfolio steady.
Beginners thrive pairing this with real-time signals, dodging full exposure. Fibre's throughput and rising blob sizes mean upside skews hedged plays toward profit.
These strategies, rooted in Blobspace Markets' tools, demystify celestia blobspace analytics for 2026. From fee jumps to throughput scales, dashboards paint the full picture, letting you trade data blobs with confidence. Dive in, connect those dots, and watch trends unfold into real gains amid NFT booms and rollup rushes.


No comments yet. Be the first to share your thoughts!