
Celestia’s blobspace market is at a pivotal moment. In the last two weeks, average blob sizes have exploded from around 1.18 GB to an astonishing 11.4 GB, while daily transactions surged from 44,000 to over 71,000. This dramatic growth signals not only heightened demand for data availability but also a rapidly evolving fee landscape that every trader and developer in the Celestia ecosystem needs to understand.
Decoding Blob Pricing Trends: Why Now?
With Celestia (TIA) currently trading at $1.48, the network is experiencing what many are calling a blobspace tipping point. According to Conduit, blobs are still in price discovery mode - and with transaction volumes climbing, scarcity is becoming a real consideration. The question on everyone’s mind: how will these trends impact fees and trading strategies?
Blob fees on Celestia are structured with both a flat fee per transaction and a variable component based on blob size (Celestia Docs). As blob sizes balloon, so too does the total cost of storing data on-chain. For developers and traders alike, this means monitoring not just TIA’s spot price but also the evolving economics of blobspace itself.
Using Blobspace Markets Analytics for Real-Time Insights
Blobspace Markets provides a suite of analytics tools designed specifically for dissecting these pricing dynamics in real time. Here’s how you can leverage them:
- Blob Data Leaderboard: See which namespaces are driving the most volume, fees paid, and median cost per blob.
- Fee Trend Visualizations: Track how average fees per GB shift as demand waxes and wanes.
- Transaction Heatmaps: Identify surges in activity linked to NFT launches or new exchange integrations.
This data isn’t just academic - it’s actionable intelligence for anyone looking to optimize their trading or deployment strategies as network conditions change.
The Supply-Demand Paradox: Are Blobs Becoming Scarce?
The current environment echoes findings from Ethereum Research’s analysis of the “target demand paradox” in blob fee markets: effective demand is hovering near system capacity, suggesting that even minor increases could push fees sharply higher. On Celestia, this dynamic is amplified by recent adoption waves from CLOB-based exchanges like Hyperliquid and Hibachi (theblock.co). As more projects compete for limited blockspace, understanding when blobs become scarce - and how that scarcity translates into pricing power - is crucial.
Celestia (TIA) Price Prediction 2026-2031
Professional forecast based on current blobspace demand, market cycles, and adoption trends
| Year | Minimum Price | Average Price | Maximum Price | % Change (Avg vs. Prev Year) | Market Scenario Insights |
|---|---|---|---|---|---|
| 2026 | $1.10 | $1.65 | $2.80 | +11% | Consolidation phase; volatility as blob adoption stabilizes and fee market matures |
| 2027 | $1.30 | $2.00 | $4.20 | +21% | Renewed rollup/NFT activity; possible bull cycle; increased network usage |
| 2028 | $1.70 | $2.70 | $6.10 | +35% | Wider modular blockchain adoption; new DA use cases expand demand |
| 2029 | $1.90 | $3.35 | $8.50 | +24% | Potential scaling breakthroughs; regulatory clarity boosts institutional interest |
| 2030 | $2.10 | $4.10 | $12.00 | +22% | Blobspace scarcity drives higher fees; competition from other DA layers intensifies |
| 2031 | $2.50 | $5.10 | $16.50 | +24% | Matured ecosystem; mainstream adoption of modular chains; TIA as a core DA asset |
Price Prediction Summary
Celestia (TIA) is forecast to see steady growth from 2026 to 2031, driven by increasing demand for blobspace, scaling of rollups, and broader adoption of modular blockchain architectures. While volatility and competition may cause fluctuations, the long-term outlook remains bullish if Celestia continues leading the data availability sector.
Key Factors Affecting Celestia Price
- Continued surge in blob usage and transaction volumes
- Adoption of Celestia as a preferred data availability layer for rollups and NFTs
- Fee market dynamics and potential scarcity of blobspace
- Emergence of competing data availability solutions (EigenDA, Avail, etc.)
- Regulatory clarity around modular blockchain infrastructure
- Technological improvements in scalability and interoperability
- Macro crypto market cycles and investor sentiment
Disclaimer: Cryptocurrency price predictions are speculative and based on current market analysis. Actual prices may vary significantly due to market volatility, regulatory changes, and other factors. Always do your own research before making investment decisions.
If you’re trading blobs or deploying high-throughput applications on Celestia right now, you’re operating in one of crypto’s most fascinating emerging markets. The interplay between TIA price action (currently holding at $1.48), network usage spikes, and fee volatility creates both risk and opportunity for those who know where to look.
Blobspace Markets analytics can help you visualize these supply-demand imbalances as they unfold. By tracking hourly and daily shifts in median blob fees, you can spot when congestion is building and anticipate potential fee spikes before they hit your bottom line. For instance, recent data shows that as average blob sizes climbed toward 11.4 GB and transactions topped 71,000 per day, fee volatility increased sharply, mirroring historical tipping points seen on other modular blockchains.
But it’s not just about watching the numbers. The real power comes from connecting the dots between blobspace market analytics and broader ecosystem catalysts. NFT mints, rollup launches, or protocol upgrades can all send shockwaves through blob demand, and with Blobspace Markets’ heatmaps and leaderboard tools, you can quickly isolate which namespaces or dApps are driving the action.
Trading Strategies for Celestia Data Blobs
So how do you turn these insights into actionable strategies? Here’s a practical approach for both traders and builders navigating today’s dynamic blob market:
Top Trading Strategies for Celestia Blobs in High-Fee Markets
- Monitor Blob Fee Trends with Celenium Gas Tracker: Use Celenium’s Gas Price Tracker Widget to spot fee spikes in real time. This helps you time blob submissions to periods of lower congestion, minimizing costs during volatile markets.
- Leverage the Celestia Analytics Dashboard for Namespace Insights: Analyze the Blob Data Leaderboard to identify which namespaces are driving fee surges. Target less competitive namespaces to reduce your overall blob fees.

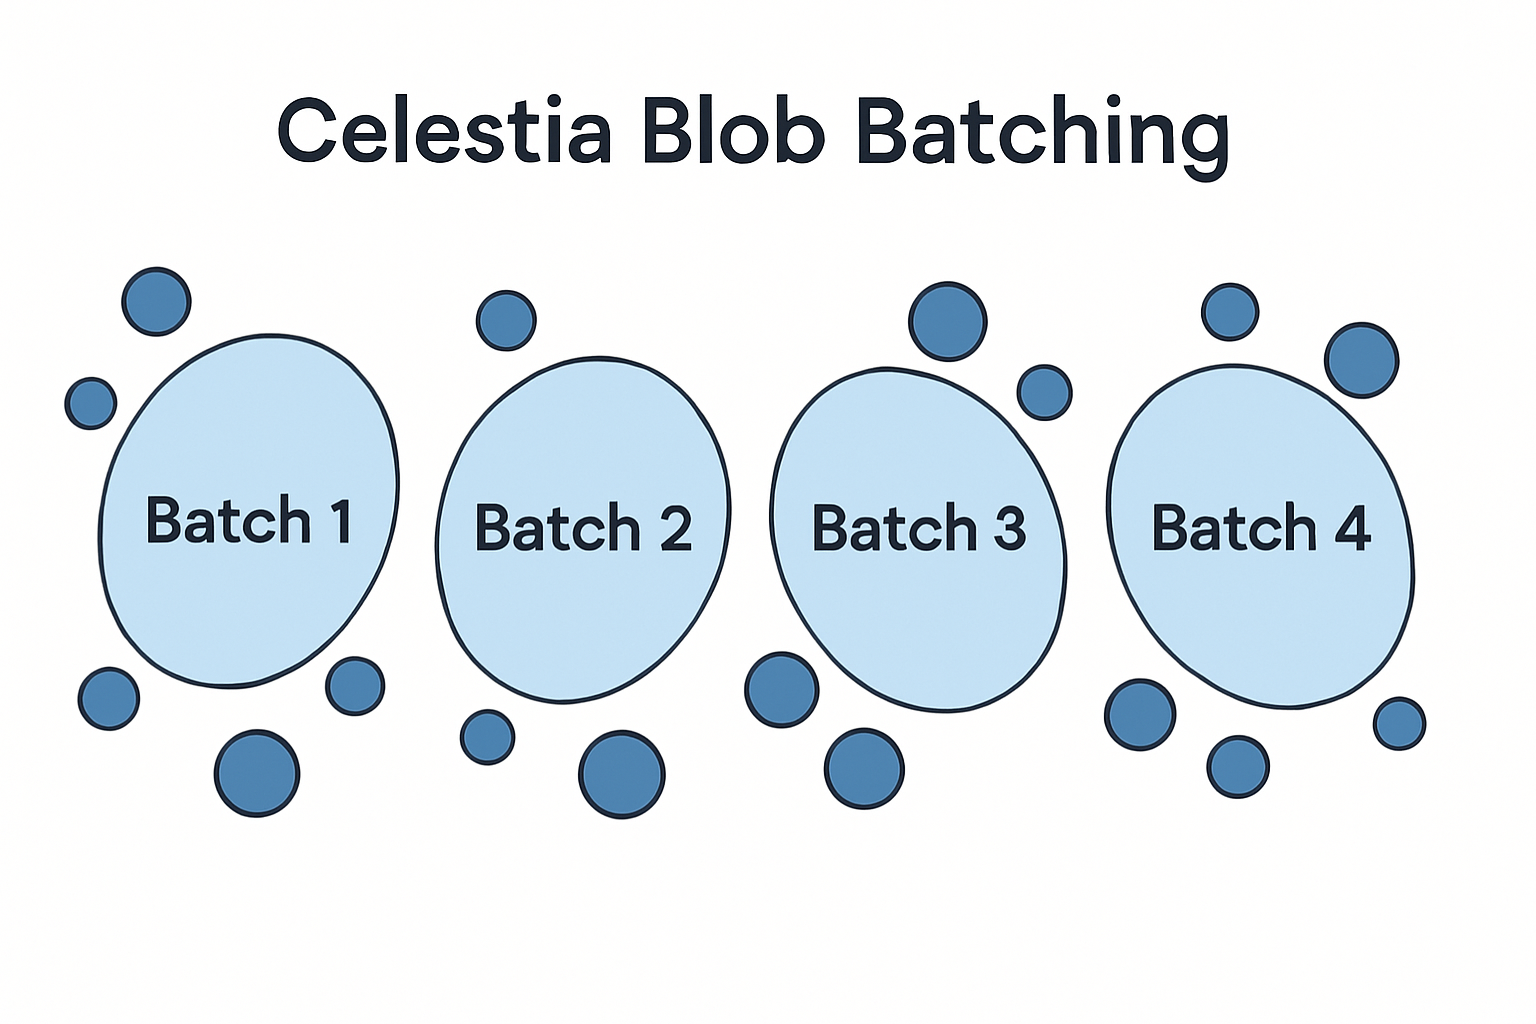
- Batch Transactions to Optimize Blob Utilization: With average blob sizes surging to 11.4 GB, grouping multiple transactions into a single blob can help you share costs and improve fee efficiency during peak periods.
- Stay Updated on Network Activity via Professor Jo and Conduit: Follow leading analysts and data sources to receive timely alerts about blobspace congestion and evolving trading opportunities.

1. Monitor Fee Floors: Use live fee trackers to set alerts when average fees per GB pass your risk threshold. This helps prevent overpaying during peak congestion.
2. Time Your Transactions: Analyze transaction heatmaps to identify low-activity windows, often late at night or between major launches, when fees are lower.
3. Diversify Blob Usage: If you’re managing multiple deployments, spread activity across less congested namespaces to avoid competing directly with high-volume dApps.
4. Hedge with TIA: As TIA price (currently $1.48) fluctuates alongside network activity, consider using options or spot holdings to offset potential cost surges in blobspace usage.
Visualizing Real-Time Trends
The best way to stay ahead is by using Blobspace Markets’ interactive tools in tandem with external dashboards like theblock.co. Pair on-chain analytics with macro context, such as NFT cycles or exchange integrations, to forecast shifts before they appear in spot prices or average fees.
This holistic approach is especially important as Celestia’s ecosystem matures. With more protocols leveraging its data availability layer, and TIA price still near its post-ATH lows, the next wave of adoption could push blobs into true scarcity territory, fundamentally reshaping both pricing dynamics and trading opportunities.
What Comes Next? Staying Proactive in a Fast-Moving Market
The bottom line: analyzing Celestia blob pricing trends isn’t just about following charts, it’s about understanding the interplay between technology adoption, market psychology, and real-time network dynamics. Whether you’re a developer deploying new rollups or a trader seeking alpha in emerging asset classes, Blobspace Markets gives you the visibility needed to act decisively.
If current trends continue, with average blob sizes staying above 11 GB and transactions holding near all-time highs, expect further fee volatility and potentially rapid price discovery for both blobs and TIA tokens alike.
The most successful participants will be those who treat every spike in usage not just as a challenge but as an opportunity to refine their strategies using granular market data. As always: connect the dots, see the trend, and let real-time analytics be your edge in the evolving Celestia blobspace marketplace.


No comments yet. Be the first to share your thoughts!