
Celestia’s data blob market is undergoing a seismic shift. In the past two weeks, average blob sizes have skyrocketed from 1.18 GB to an eye-popping 11.4 GB, according to The Block. This surge is not merely a technical milestone; it signals a fundamental transformation in how blockchains leverage Celestia for scalable, decentralized data availability. The record-high utilization of 6 blobs per block has direct implications for developers, traders, and anyone tracking Celestia trading trends or engaged in data blobs analytics.
Why 6 Blobs per Block Matters Right Now
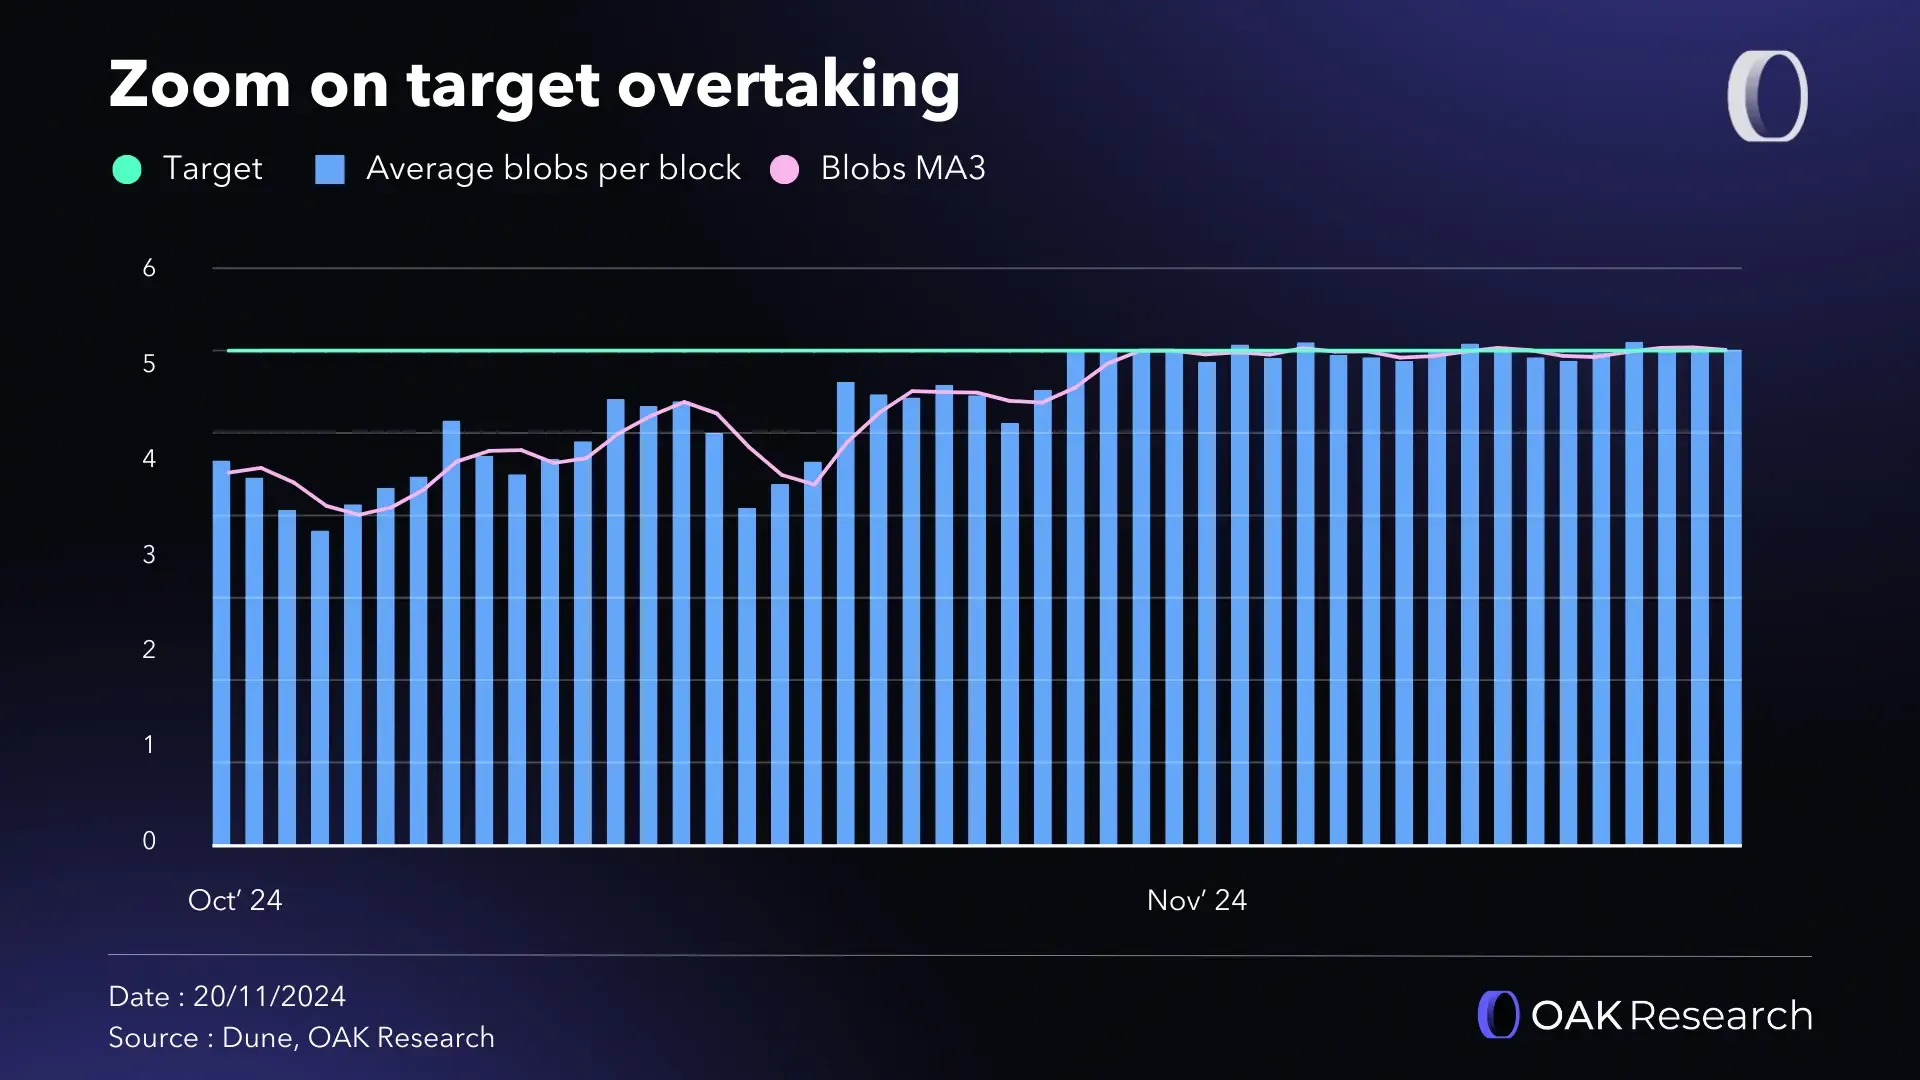
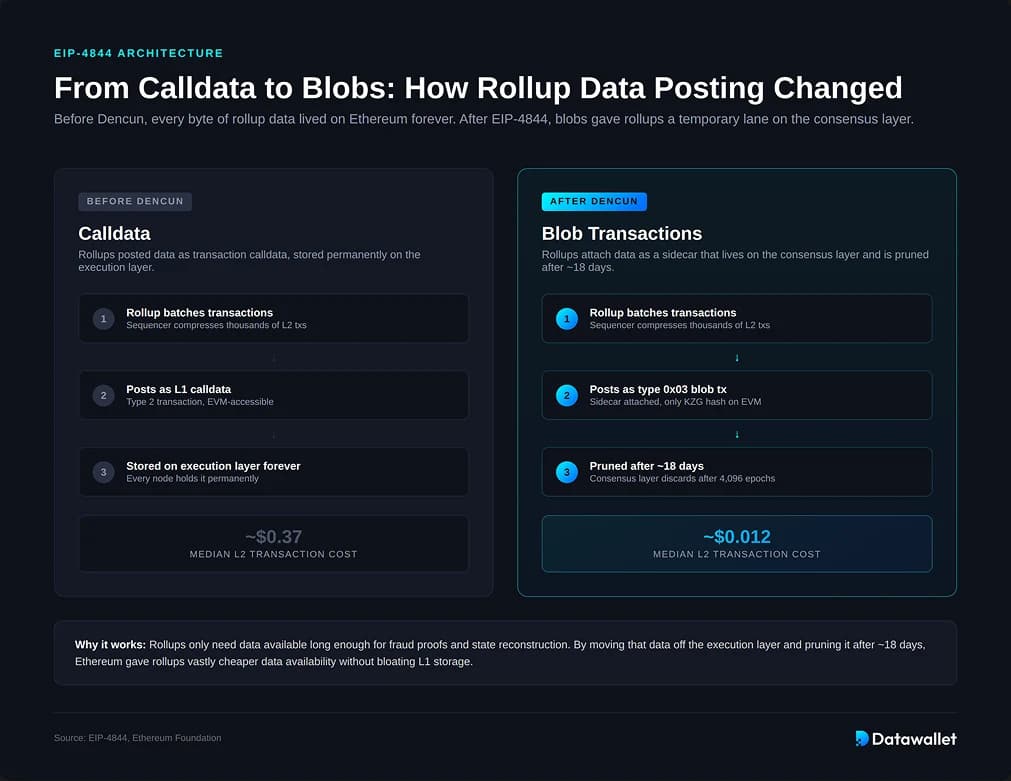
For context, Ethereum’s EIP-4844 established a maximum of 6 blobs per block with a target of 3 - a design meant to balance capacity and network stability. Celestia now routinely operates at this upper limit, reflecting surging demand from high-volume applications like NFT minting (notably Forma’s Mammoth Overlord NFTs) and Layer 2 solutions such as Eclipse and RARI chain integrations. With TIA priced at $1.43 (up and 0.0600 or and 0.0438% over the last 24 hours), the market is waking up to what increased blob throughput means for both utility and value.
Celestia’s ability to consistently handle full blocks at the maximum blob limit puts it at the forefront of modular blockchain scaling.
The Data Behind the Surge: Blobs, Fees, and Market Dynamics
Diving into the analytics, several forces are fueling this leap in blobspace utilization:
- NFT Activity: Projects like Forma’s Mammoth Overlord NFTs are driving up both transaction counts and average blob size.
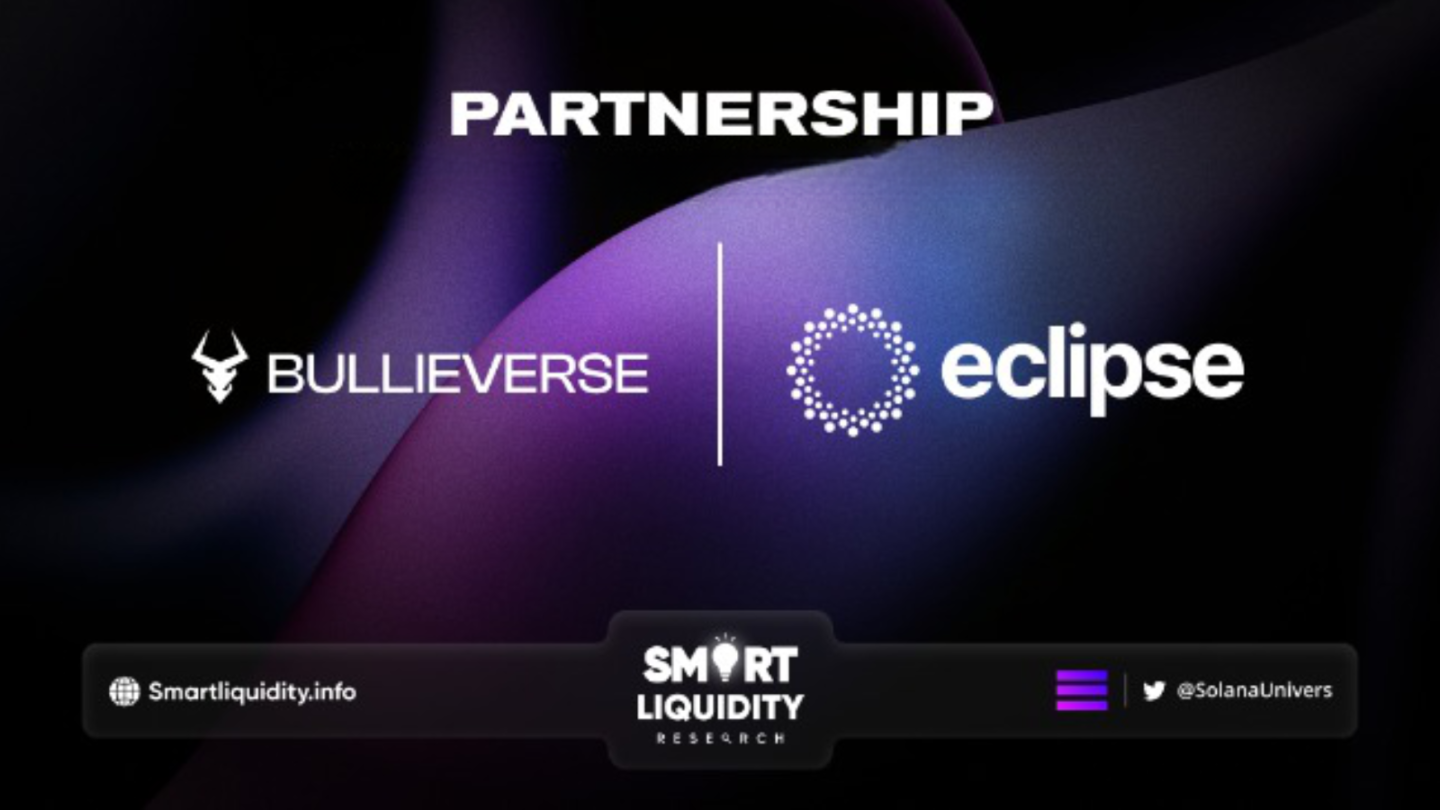
- L2 Rollup Adoption: Eclipse’s use of Celestia as its data availability layer has resulted in more frequent and larger blob postings.
- Fee Market Dynamics: As blocks approach or hit the 6-blob cap, base fees rise exponentially (in line with mechanisms outlined by Conduit), incentivizing efficient use of space while also impacting median costs per blob.
This confluence creates a feedback loop: more projects compete for limited blobspace, fees rise, and market participants must optimize their strategies accordingly. For traders and analysts on Blobspace Markets, these conditions offer new opportunities - but also new risks - as pricing trends become more volatile with each uptick in utilization.
Celestia Trading Trends: What Record Blob Usage Signals
The current environment is not just about raw technical throughput; it is about how that throughput translates into real market action. With TIA holding steady at $1.43, investors are watching closely to see if sustained high demand for blobs will translate into deflationary pressure on token supply or open new arbitrage windows in secondary markets.
Celestia (TIA) Price Prediction 2026-2031
Professional outlook based on rising blob usage, expanding data availability markets, and evolving blockchain adoption.
| Year | Minimum Price | Average Price | Maximum Price | Year-over-Year % Change (Avg) | Key Market Scenario |
|---|---|---|---|---|---|
| 2026 | $1.10 | $1.70 | $2.80 | +18.9% | Increased adoption from rollups, NFT activity sustains network demand |
| 2027 | $1.20 | $2.10 | $3.60 | +23.5% | Blobspace demand rises as more L2s adopt Celestia; competition with EigenDA intensifies |
| 2028 | $1.40 | $2.60 | $4.50 | +23.8% | Ecosystem matures with further NFT and DeFi integrations; possible deflationary pressure on TIA |
| 2029 | $1.60 | $3.20 | $5.80 | +23.1% | Scaling upgrades and higher blob limits drive usage; regulatory clarity improves institutional participation |
| 2030 | $1.85 | $3.85 | $7.10 | +20.3% | Global blockchain adoption accelerates; Celestia's modular stack gains traction |
| 2031 | $2.10 | $4.60 | $8.50 | +19.5% | Celestia solidifies position as a leading data availability layer; increased competition but robust market share |
Price Prediction Summary
Celestia (TIA) is projected to experience steady long-term growth, driven by the rising adoption of blobspace for NFTs, rollups, and data-heavy blockchain applications. The average price is expected to more than double over the next six years, with the possibility of outsized gains in bullish scenarios if blob usage and network activity continue to accelerate. Bearish scenarios reflect market competition, regulatory headwinds, or slower adoption, but the overall outlook remains positive as Celestia's unique value proposition strengthens its position in the evolving modular blockchain landscape.
Key Factors Affecting Celestia Price
- Surging blob usage and data availability demand from NFTs, rollups, and new applications
- Potential for TIA token to become deflationary with increased on-chain activity and fee burns
- Expansion of Ethereum Layer 2 solutions (EIP-4844, Pectra) increasing overall demand for data availability
- Integration with prominent projects such as Eclipse and RARI chain
- Regulatory developments impacting crypto adoption and usage
- Competition from other data availability solutions (e.g., EigenDA, Avail)
- Technology upgrades increasing blob capacity and network efficiency
- General crypto market cycles and macroeconomic conditions
Disclaimer: Cryptocurrency price predictions are speculative and based on current market analysis. Actual prices may vary significantly due to market volatility, regulatory changes, and other factors. Always do your own research before making investment decisions.
The Competitive Edge: Celestia vs EIP-4844 Blobs
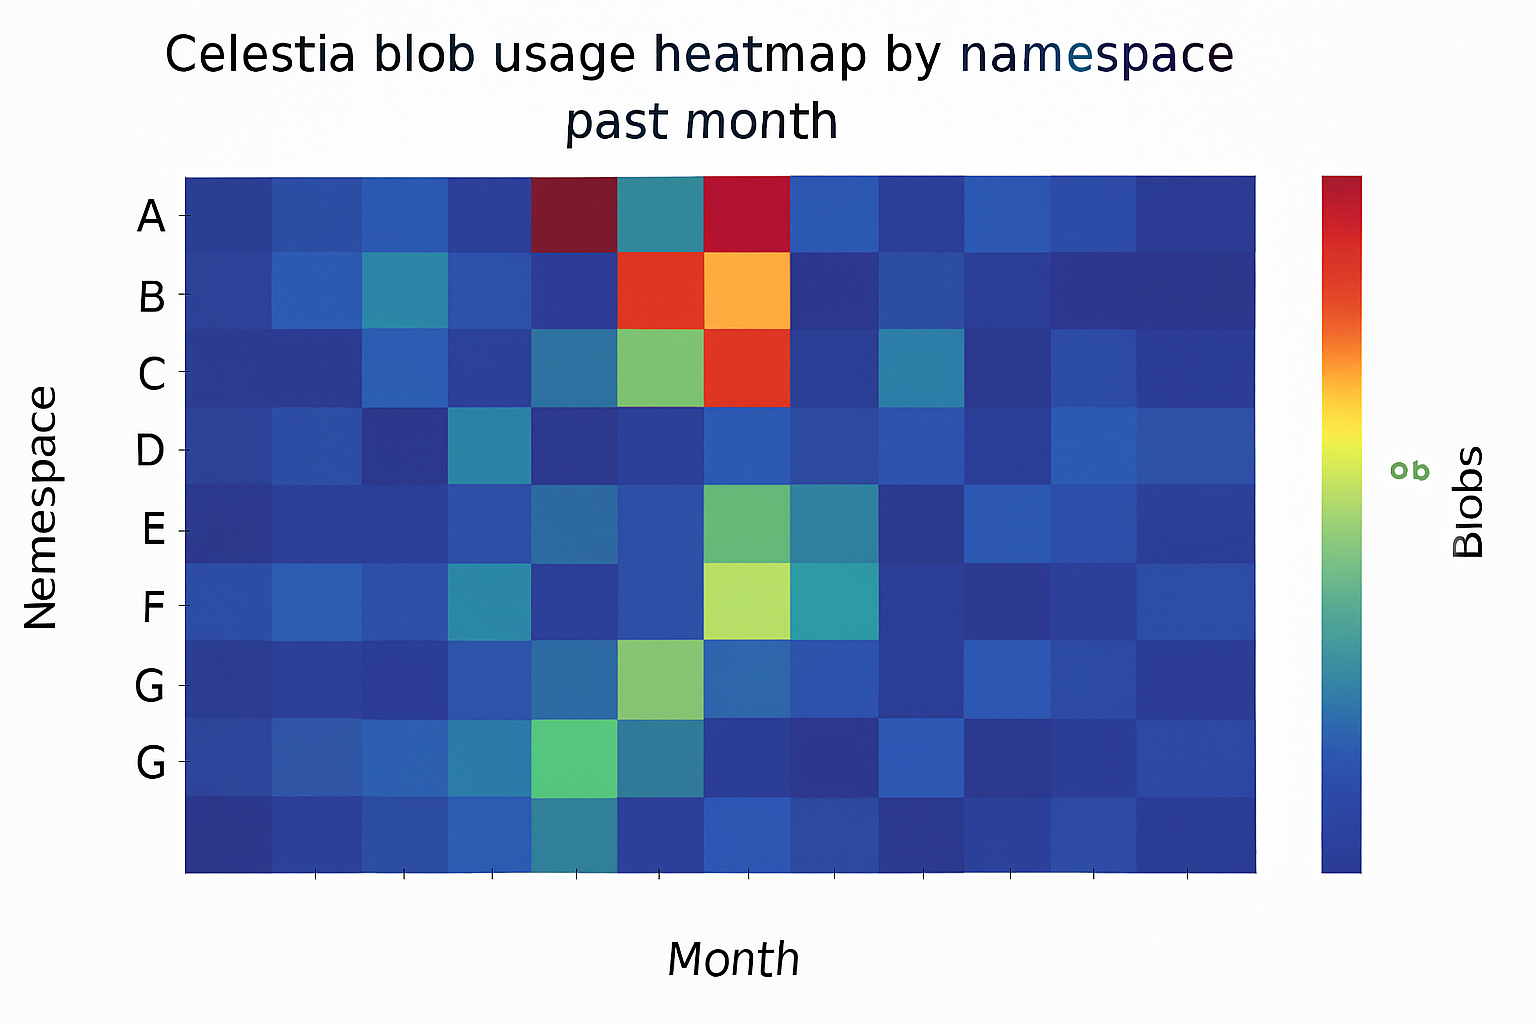
The maximum of 6 blobs per block puts Celestia on par with Ethereum post-EIP-4844 - but there are key differences that matter for both developers and traders. Unlike Ethereum’s stricter fee escalation curve, Celestia offers nuanced fee dynamics via its leaderboard-driven analytics dashboard (as seen on Blockworks), allowing users to track active namespaces by volume, fees paid, and median cost per blob in real time.
This transparency empowers users to make informed decisions about when to submit data blobs or execute trades based on evolving market conditions rather than static protocol rules alone.
As Celestia’s blob throughput rivals Ethereum’s, the nuances in its fee market and analytics tooling are drawing increased attention from data scientists, developers, and trading desks. The Blob Data Leaderboard, for instance, lets users pinpoint which namespaces are driving volume spikes and how median costs react to congestion. For those actively trading or arbitraging blobs, this granularity is indispensable.
Bandwidth implications are also front and center. As highlighted by recent research, more blobs per block mean validators must process larger volumes of data in each slot. While network bandwidth increases only modestly with each additional blob, the compounding effect during periods of sustained high activity could pressure less-resourced nodes, potentially leading to shifts in validator composition or service provider strategies.
Risks and Opportunities: Navigating Blobspace Market Volatility
For market participants on Blobspace Markets, these record usage levels usher in a new era of volatility but also opportunity. As blocks fill up and fees climb, traders may see sharper price dislocations, especially during surges driven by NFT mints or rollup launches. This environment rewards those who can monitor real-time analytics and act quickly on pricing anomalies or sudden demand spikes.
Key Risks and Opportunities for Celestia Blob Traders
- Rising Blob Fees and Volatility: As average blob size surged nearly 10x to 11.4 GB, blob fees have become more volatile, especially during NFT mints and high network activity. Traders must monitor fee spikes, as sudden demand can rapidly erode profit margins.
- Blobspace Scarcity and Market Dynamics: With the 6-blob-per-block limit (matching Ethereum's EIP-4844), competition for blobspace has intensified. This scarcity can drive up prices, presenting both arbitrage opportunities and risks of overpaying for data availability.
- Integration with Major Rollups: Platforms like Eclipse and RARI chain are actively using Celestia for data availability. Traders can capitalize on trends by tracking which rollups are driving blob demand and adjusting strategies accordingly.
- Impact of NFT Activity: Projects such as Forma's Mammoth Overlord NFTs have caused significant spikes in blob usage. Monitoring NFT launches and ecosystem events can help traders anticipate periods of high demand and fee changes.

- Potential for TIA Token Deflation: Increased blob usage could lead to higher TIA fee burns. With Celestia (TIA) currently priced at $1.43, traders should watch for supply changes that may impact token value and trading strategies.
- Bandwidth and Node Performance Risks: The increase in blob count and size puts more strain on node bandwidth and storage. Traders relying on fast inclusion or running nodes should assess infrastructure risks as network demands grow.

Fee escalation mechanisms serve as both a throttle and a signal. When base fees rise exponentially with each additional blob beyond the target (as designed), it not only deters spam but also signals to sophisticated actors when to deploy capital for maximum impact. The result is a more dynamic market, one where timing matters as much as scale.
Celestia’s role as a modular data availability layer is being stress-tested in real time, and so far, it’s passing with flying colors.
Outlook: Is This the New Normal for Blobspace?
With TIA holding at $1.43, the question becomes whether this surge in blob usage represents a lasting shift or merely a temporary spike tied to current NFT and rollup activity. If high utilization persists, and if proposed protocol upgrades further raise the blob cap, the market could see continued upward pressure on fees but also broader participation from new projects seeking scalable data solutions.
Looking ahead, analysts will be watching several key indicators:
- Sustained average blob size: Will 11 and GB remain typical or revert as activity normalizes?
- Namespace concentration: Are a few projects dominating demand, or is usage broadening?
- TIA price correlation: Does persistent high demand translate into price appreciation beyond current levels?
The next phase for Celestia may well hinge on its ability to scale without sacrificing accessibility or decentralization, a challenge that will keep both markets and protocol designers on their toes. For now, six blobs per block isn’t just a technical ceiling; it’s a signal that modular blockchain infrastructure is maturing rapidly, and that savvy participants have new frontiers to explore in the evolving blobspace ecosystem.


No comments yet. Be the first to share your thoughts!