
Celestia’s blobspace market has rapidly evolved into one of the most dynamic areas for data traders and blockchain analysts. As of September 30,2025, Celestia (TIA) is trading at $1.39, with a slight 24-hour dip of 0.0142%. But beneath these modest price fluctuations lies a surge in blob activity: average daily blob sizes have exploded from 1.18 GB to over 11.4 GB in just two weeks, while daily transactions have jumped to 71,000. This paints a fast-moving landscape where real-time analytics and sharp market intelligence are essential tools for anyone looking to capitalize on Celestia blob pricing trends.
Why Blob Pricing Trends Matter More Than Ever
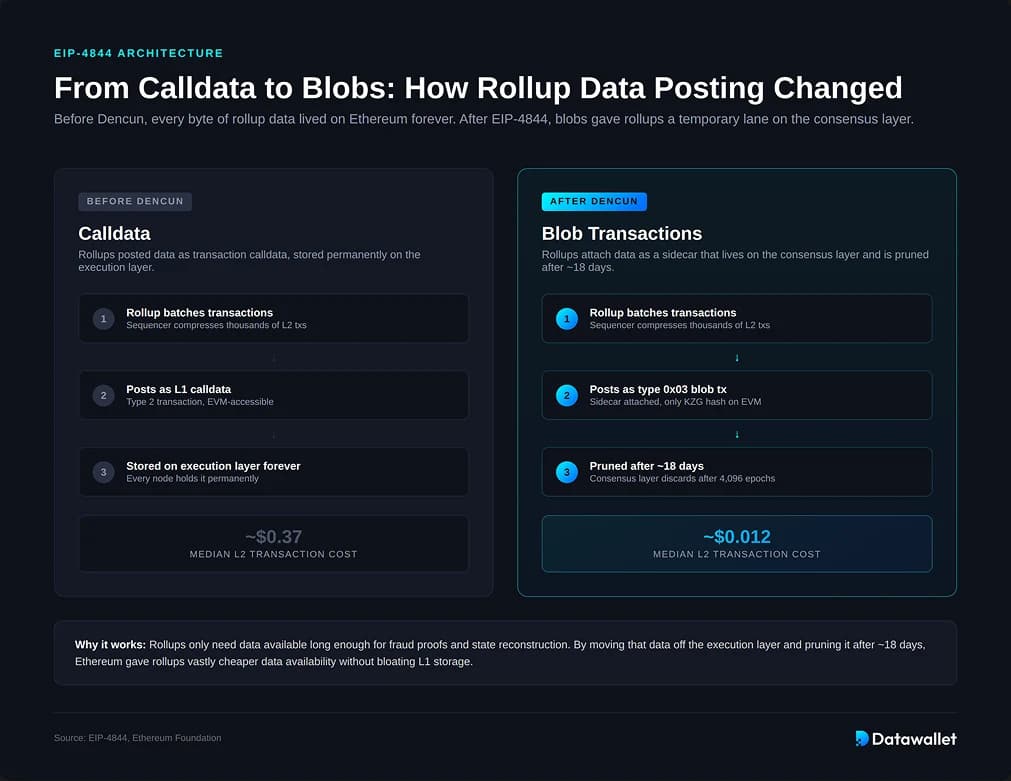
Celestia’s role as the data availability layer for 26 rollups - including Eclipse, which leads with $41.59M in TVL - means that the cost and demand for blobs directly impact network economics. With NFT minting booms (like Mammoth Overlord NFTs on Forma) and new integrations (such as RARI chain), the sheer volume of data posted to Celestia has never been higher. Notably, posting costs have dropped from $0.30 per mebibyte in November 2024 to just $0.07 today (source), making it even more crucial for traders to stay ahead of market shifts.
1. Utilize Real-Time Blob Market Analytics on Blobspace Markets
Your first line of defense against volatility is live data. Blobspace Markets offers dashboards that visualize blob price fluctuations, trading volumes, and liquidity pools in real time - giving you actionable insights at a glance. For example, when NFT minting spikes or a major rollup deploys on Celestia, you’ll see immediate changes reflected in blob pricing and volume graphs.
Top Strategies & Tools for Analyzing Celestia Blob Pricing
- Utilize Real-Time Blob Market Analytics on Blobspace Markets: Leverage Blobspace Markets' live dashboards to monitor blob price fluctuations, trading volumes, and liquidity pools. This real-time data provides actionable insights for data traders seeking to capitalize on rapid market changes.
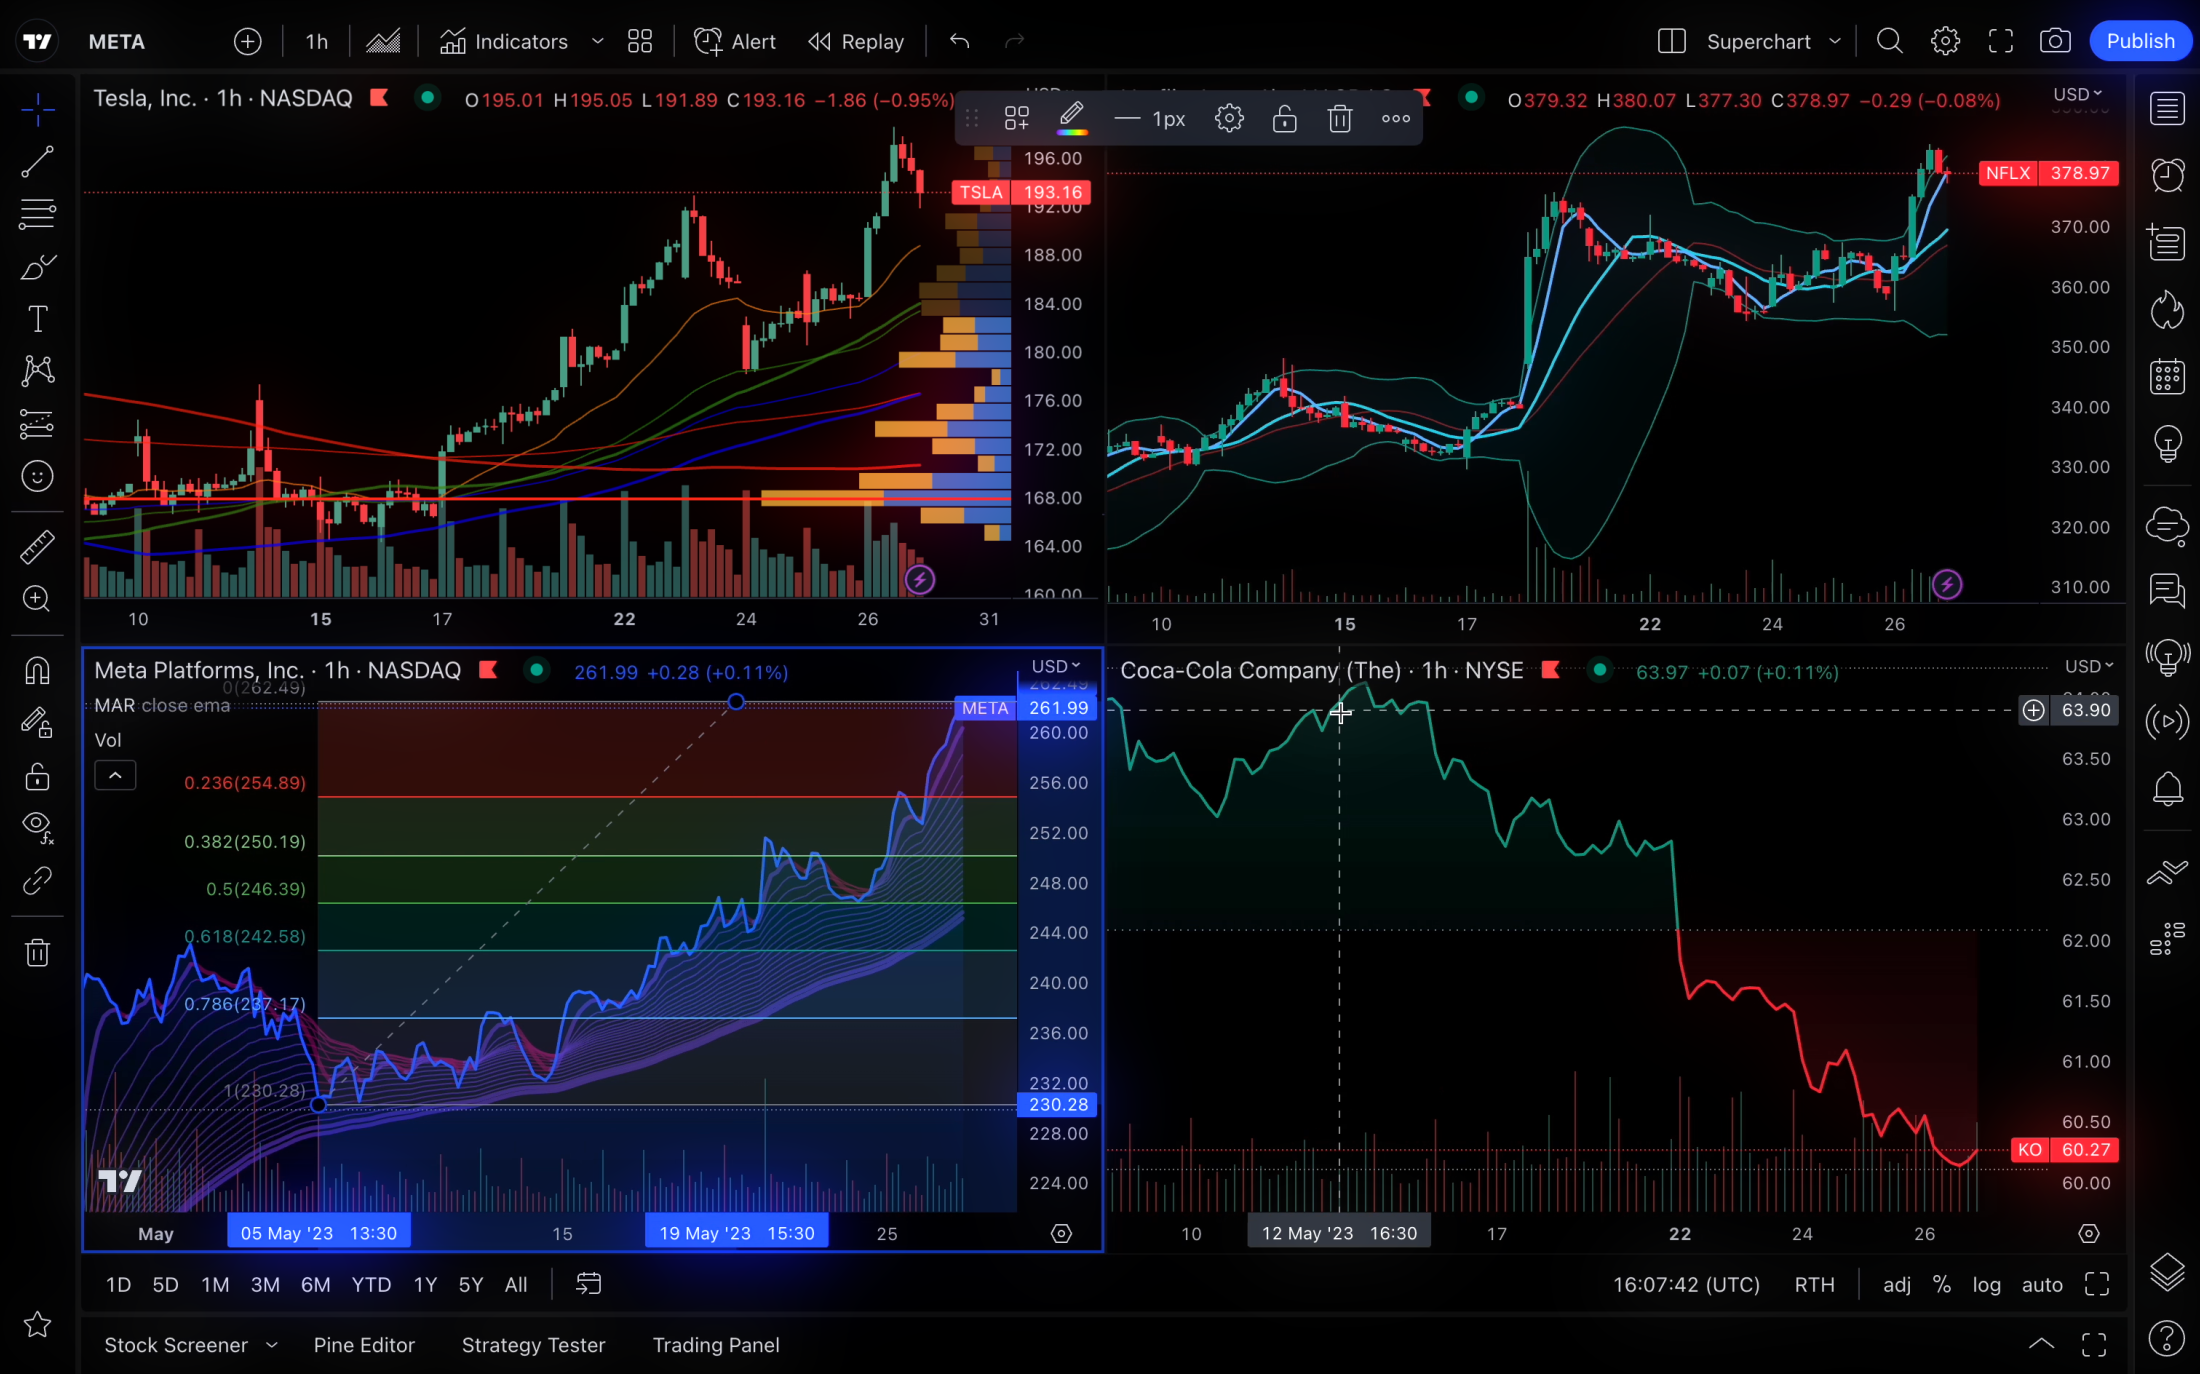
- Apply Technical Analysis Tools from TradingView Integrated with Blobspace Markets: Use popular indicators like RSI, MACD, and moving averages directly within the Blobspace Markets interface. These tools help identify optimal entry and exit points for blob trades based on historical price patterns.
- Track Macro Celestia (TIA) Price Movements and Correlate with Blob Pricing: Regularly compare the TIA token price (currently $1.39) from sources like CoinMarketCap against blob market data to spot correlations and anticipate pricing shifts.
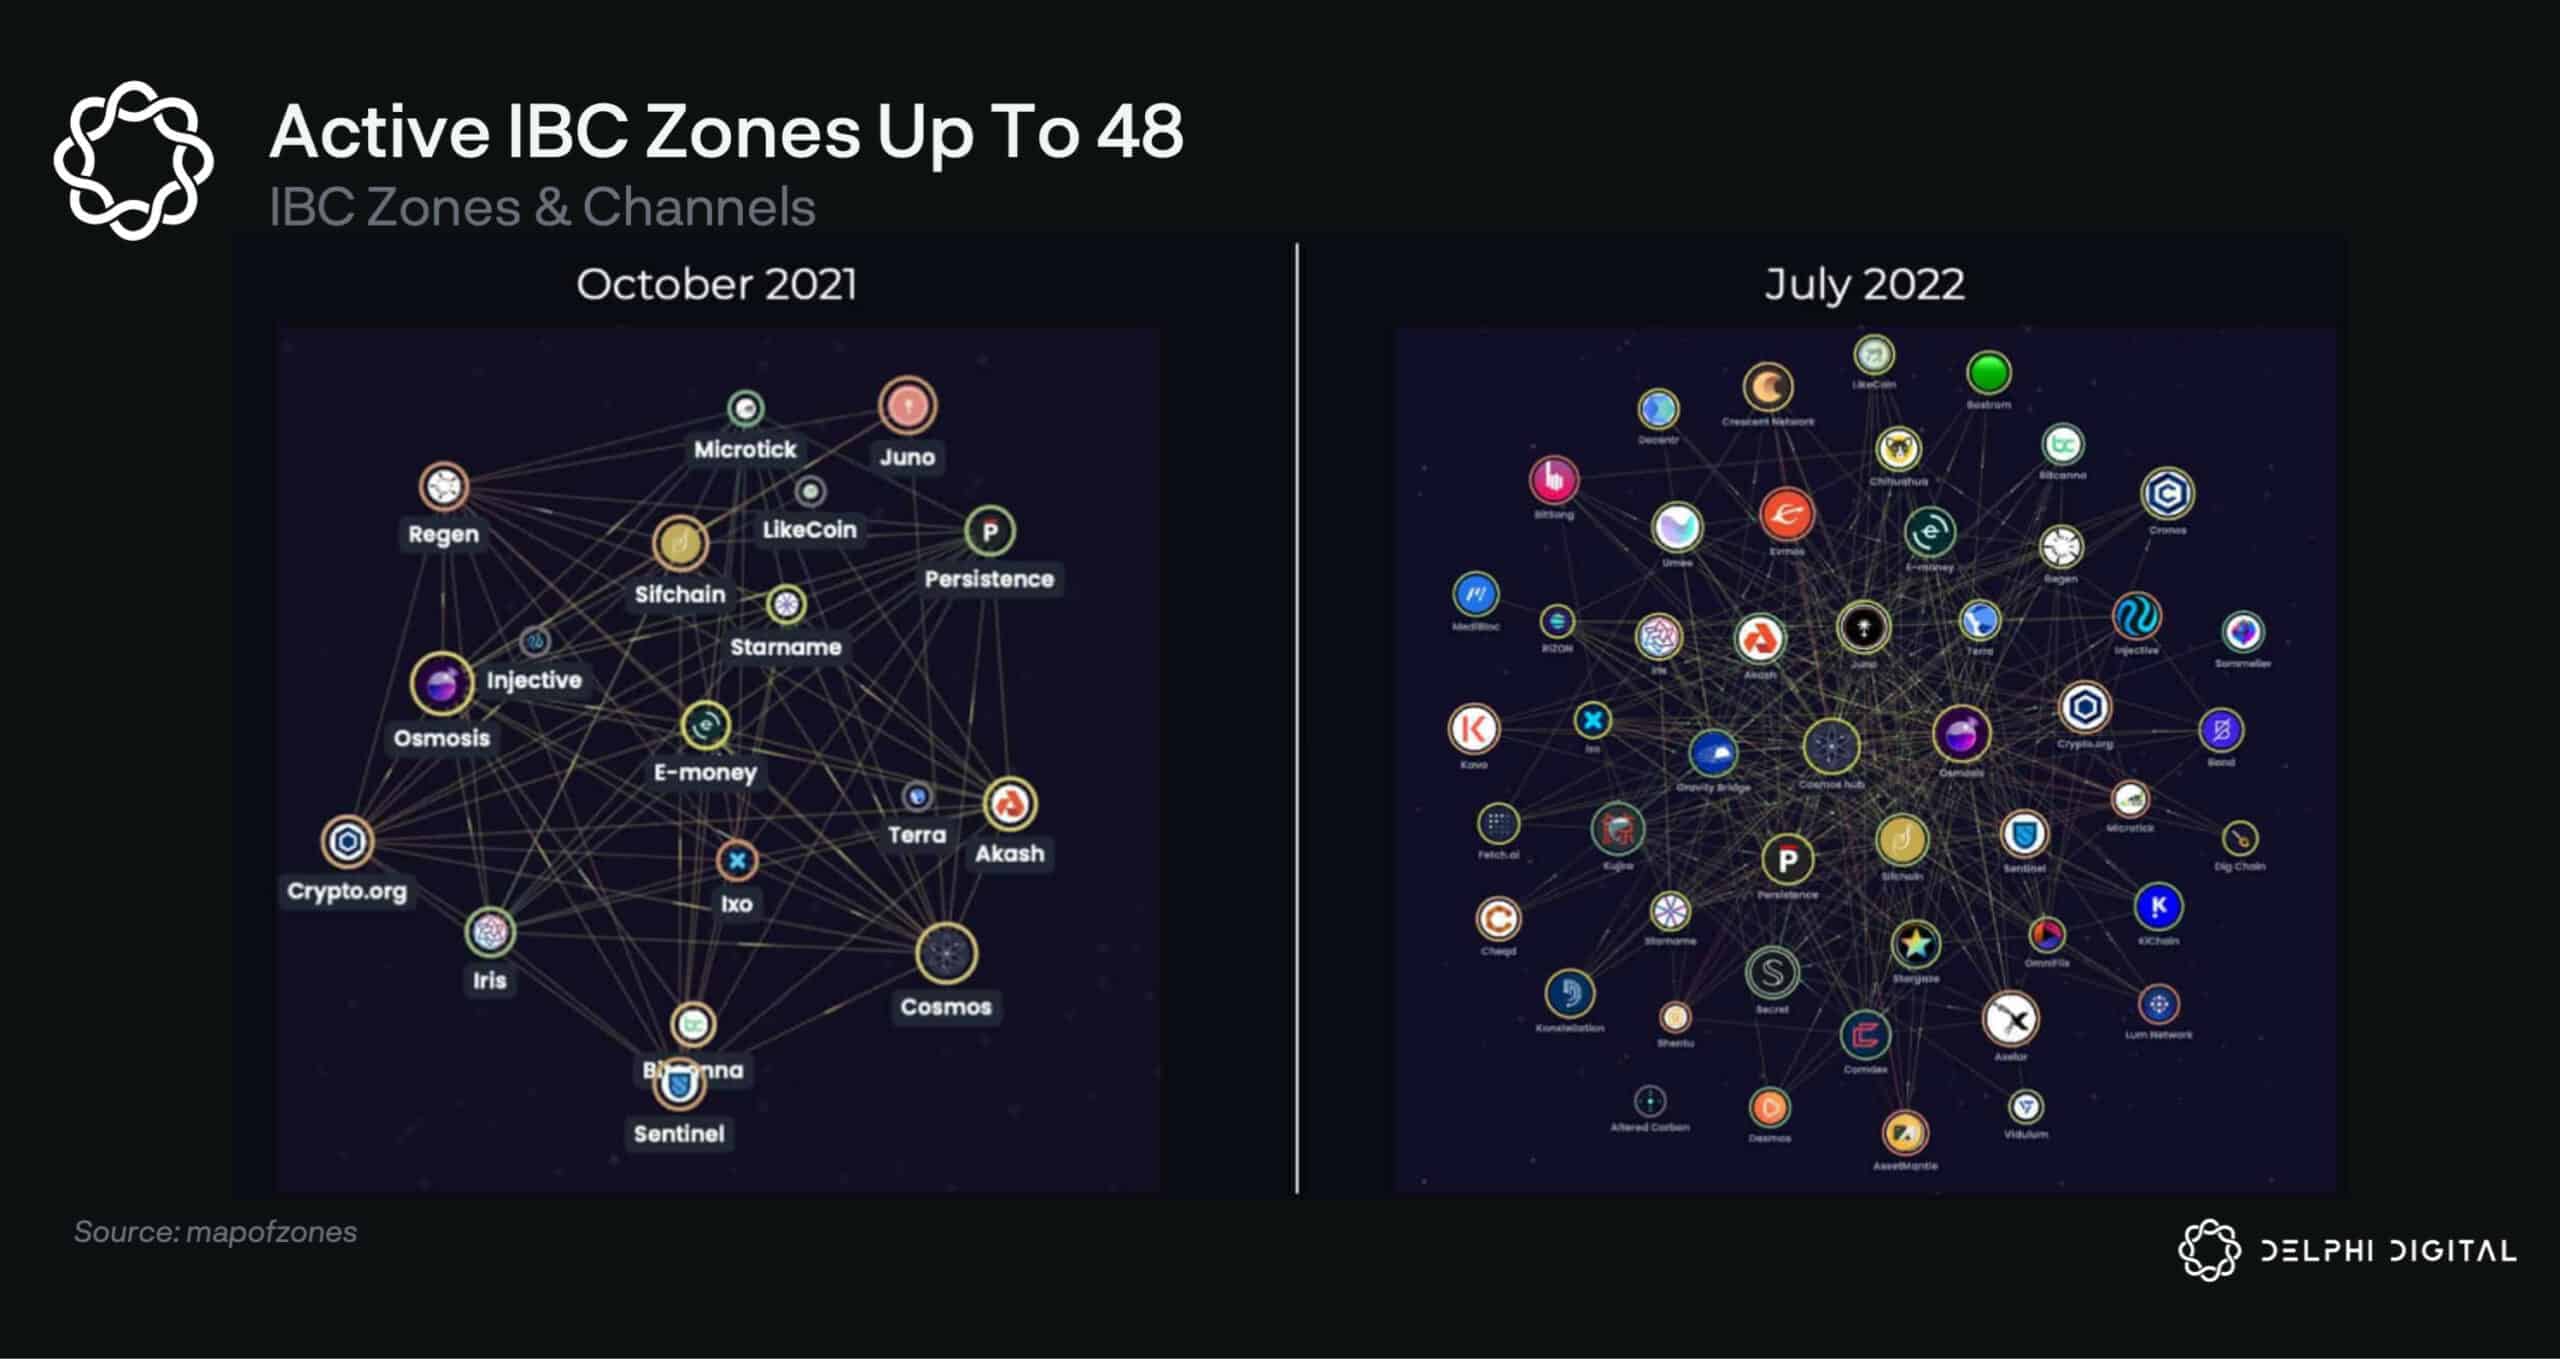
- Monitor Celestia Network Upgrades and Roadmap Developments: Stay updated on protocol changes or Data Availability (DA) improvements via official Celestia channels and research from Delphi Digital. These upgrades can significantly impact blob demand and pricing dynamics.

- Set Automated Alerts for Key Blob Market Events: Use Blobspace Markets’ alert system to receive notifications for significant price swings, volume spikes, or changes in blobspace utilization. This enables timely and informed trading decisions.
With the recent surge in average daily blob size to 11.4 GB and transactions topping 71,000 per day, watching these metrics can reveal hidden demand surges or liquidity crunches before they ripple through broader markets.
2. Apply Technical Analysis Tools from TradingView Integrated with Blobspace Markets
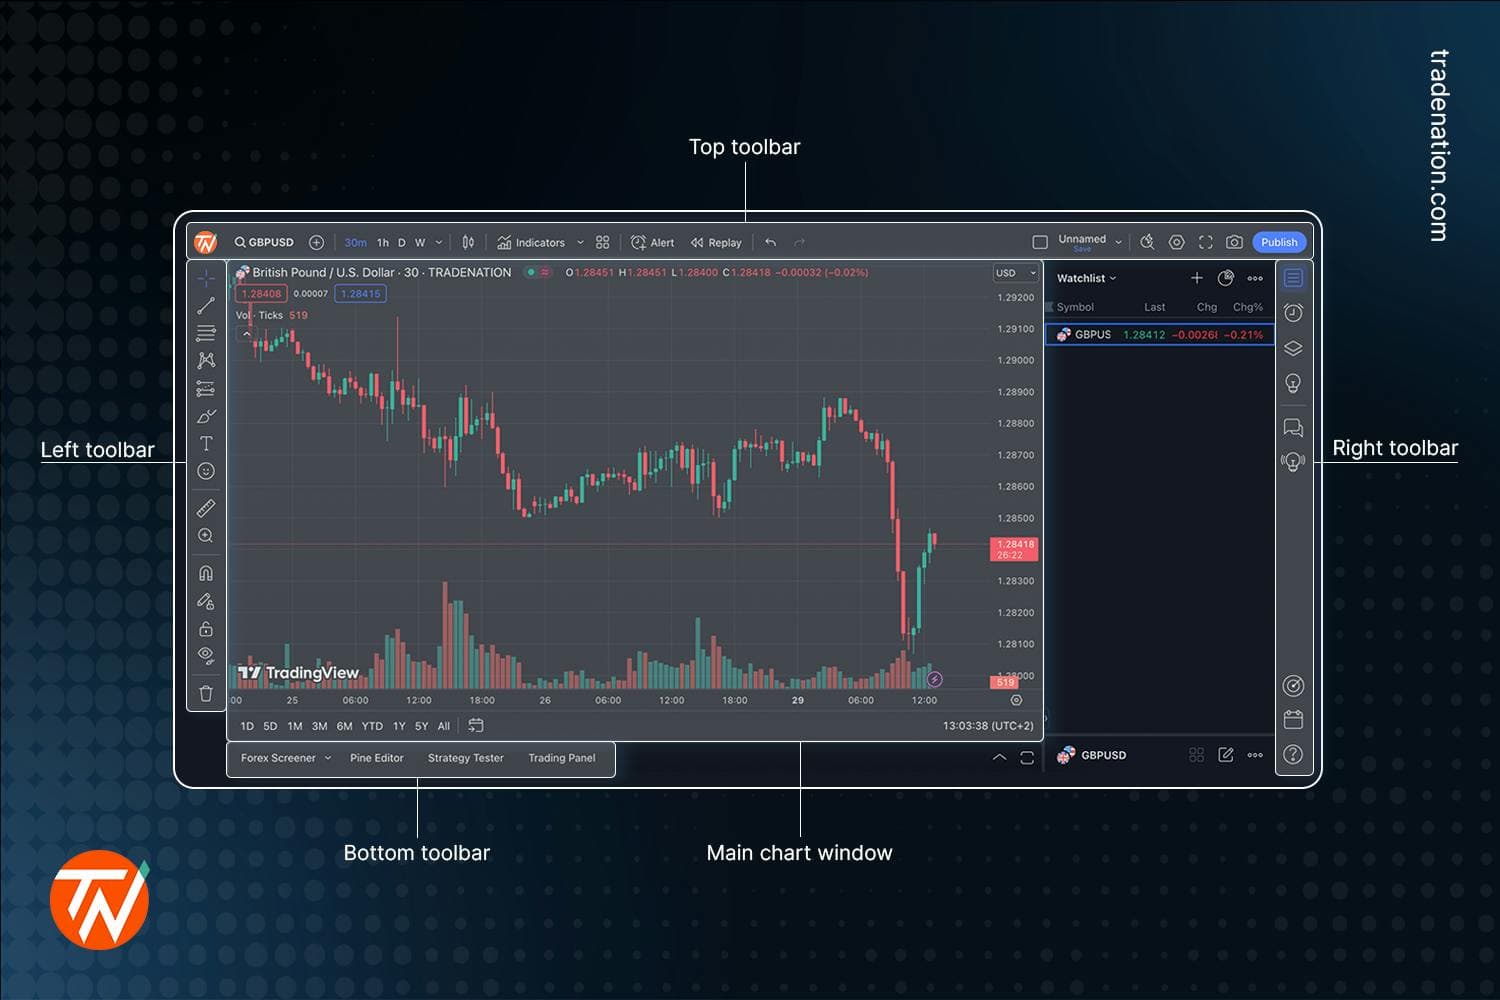
The integration of TradingView’s technical toolkit into Blobspace Markets empowers traders to move beyond raw numbers. By applying indicators like RSI (Relative Strength Index), MACD (Moving Average Convergence Divergence), and moving averages, you can spot patterns unique to blob pricing cycles.
Celestia Technical Analysis Chart
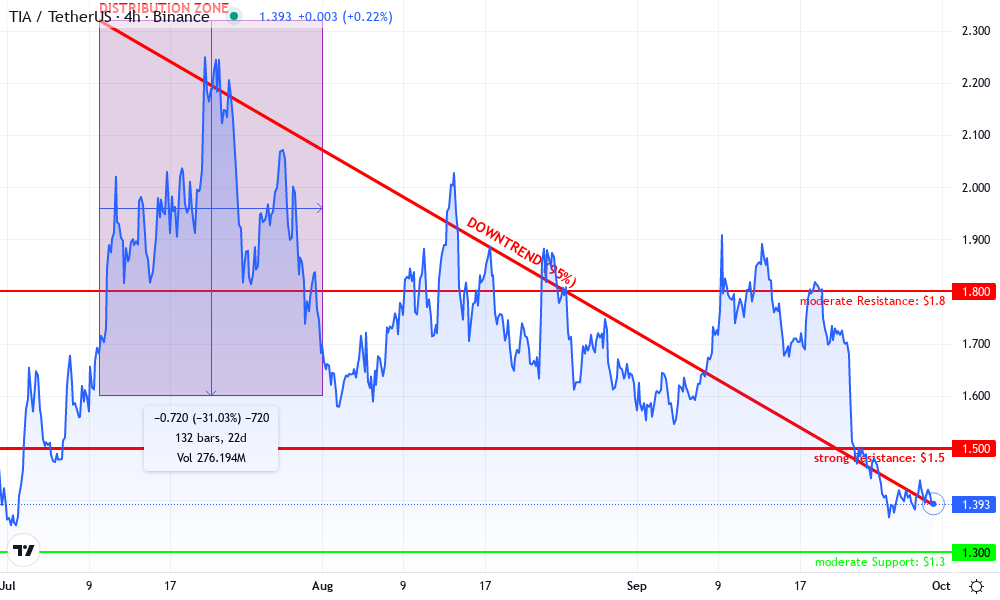
Analysis by Lila Whitmore | Symbol: BINANCE:TIAUSDT | Interval: 4h | Drawings: 6
Technical Analysis Summary
This chart reflects a pronounced downtrend in TIAUSDT from July through September 2025, with a current price of $1.391 near the bottom of its recent price range. To illustrate this, I recommend drawing a primary descending trend line from the July peak (above $2.30) to the current price. Key horizontal lines should be placed at $1.50 (former support now resistance), $1.80 (intermediate resistance), and $1.30 (potential lower support). Highlight the consolidation band just below $1.40 in late September as a potential base-forming area. Use rectangles or date/price range tools to visually capture the distribution zone in July and the consolidation in late September. Annotate the chart with callouts for the July top, mid-August lower high, and the September breakdown. The volume and MACD (not visible but based on context) would be marked with callouts/text to note declining momentum and volume into the recent lows.
Risk Assessment: medium
Analysis: The risk is balanced by washed-out sentiment and potential for a technical bounce, but the dominant downtrend and lack of reversal confirmation keep risk elevated. Only active traders should consider entries at these levels, with strict stops.
Lila Whitmore's Recommendation: Wait for clear reversal patterns or volume confirmation before initiating new swing positions. If entering, size smaller and use tight risk controls. Longer-term investors can monitor for accumulation signs, but patience remains key.
Key Support & Resistance Levels
📈 Support Levels:
- $1.3 - Potential lower support, aligns with previous price reaction zones in early July. moderate
- $1.391 - Current price area; may act as short-term support if sellers exhaust. weak
📉 Resistance Levels:
- $1.5 - Major breakdown level from mid-September, likely to act as immediate overhead resistance. strong
- $1.8 - Intermediate resistance from prior local tops in August and early September. moderate
Trading Zones (medium risk tolerance)
🎯 Entry Zones:
- $1.32 - Potential oversold bounce if price forms a double bottom or bullish divergence on lower timeframes. medium risk
🚪 Exit Zones:
- $1.5 - Take profit target on mean reversion rebound; strong resistance zone. 💰 profit target
- $1.28 - Stop loss below recent support to limit downside risk if breakdown continues. 🛡️ stop loss
Technical Indicators Analysis
📊 Volume Analysis:
Pattern: Volume likely declined into recent lows, suggesting seller exhaustion.
Monitor for a volume spike on a reversal attempt; callout or text annotation for low-volume consolidation.
📈 MACD Analysis:
Signal: MACD likely deeply negative; watch for bullish crossover or divergence as early reversal trigger.
Annotate MACD crossover attempts or divergence with arrow_mark_up on chart if visible.
Applied TradingView Drawing Utilities
This chart analysis utilizes the following professional drawing tools:
Disclaimer: This technical analysis by Lila Whitmore is for educational purposes only and should not be considered as financial advice. Trading involves risk, and you should always do your own research before making investment decisions. Past performance does not guarantee future results. The analysis reflects the author's personal methodology and risk tolerance (medium).
This approach is especially valuable now that Celestia’s network activity has decoupled from other L1s in terms of both scale and cost efficiency. For instance, while Ethereum handles around 2.5 GB/day in posted data, Celestia averages a staggering 26 GB/day - so traditional crypto TA must be calibrated for these new dynamics.
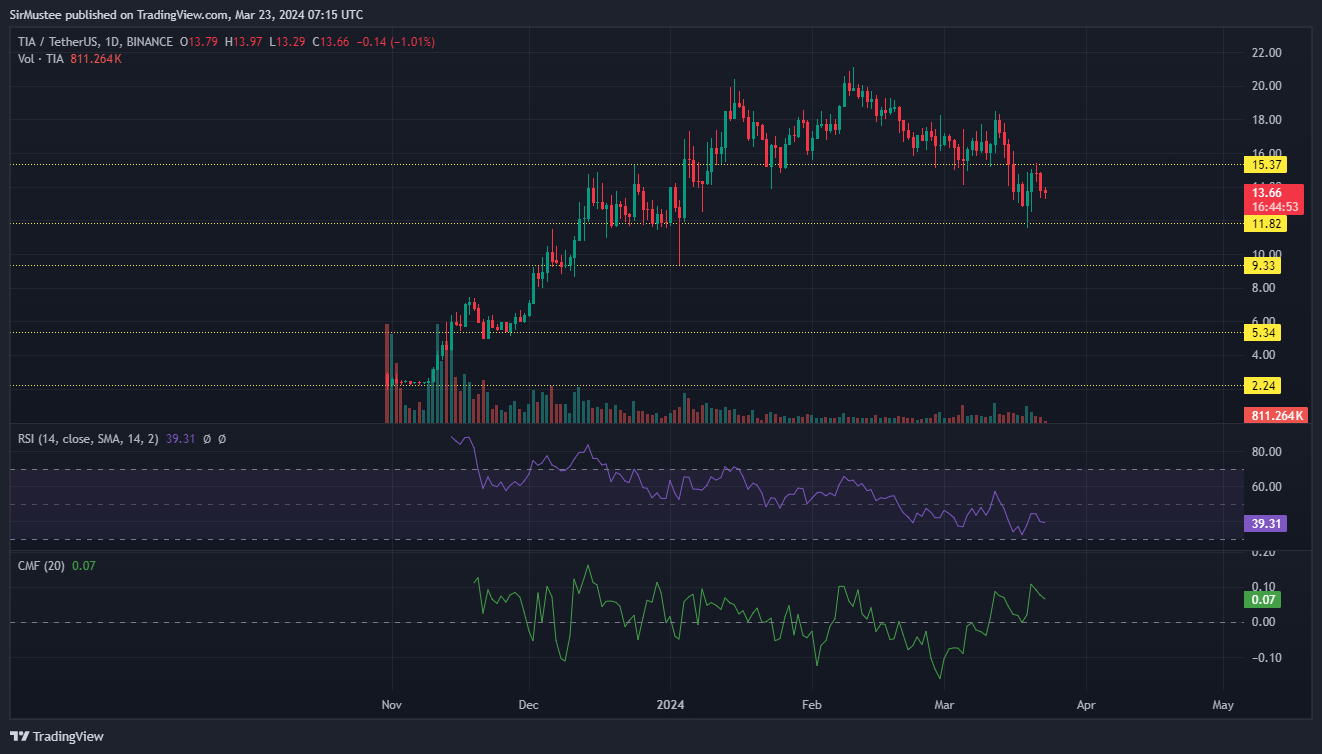
3. Track Macro Celestia (TIA) Price Movements and Correlate with Blob Pricing
The relationship between TIA token movements and blob pricing is often nuanced but critical for timing trades effectively. Monitoring TIA’s current price ($1.39) alongside blob market data can help you identify correlations or divergences that signal opportunity or risk.
Celestia (TIA) Price Prediction 2026-2031
A comprehensive outlook based on current market data, adoption trends, and technical analysis as of September 2025.
| Year | Minimum Price | Average Price | Maximum Price | % Change (Avg, YoY) | Market Scenario Insights |
|---|---|---|---|---|---|
| 2026 | $1.05 | $2.15 | $5.50 | +54.7% | Recovery from 2025 lows; adoption grows as rollups scale, but competition and regulatory uncertainty persist |
| 2027 | $2.10 | $4.80 | $10.25 | +123.3% | Bullish scenario as modular blockchain adoption accelerates; new integrations and NFT activity drive demand |
| 2028 | $3.50 | $8.40 | $18.00 | +75.0% | Celestia cements its position as leading DA layer; cost efficiencies and ecosystem expansion support higher valuations |
| 2029 | $6.20 | $12.50 | $22.50 | +48.8% | Rollup ecosystem matures, enterprise adoption increases; positive regulatory clarity boosts sentiment |
| 2030 | $8.80 | $15.75 | $28.00 | +26.0% | Sustained growth, but pace moderates; competition from new DA solutions intensifies |
| 2031 | $7.00 | $13.25 | $25.00 | -15.9% | Market correction or consolidation after rapid growth; investor focus shifts to utility and network profitability |
Price Prediction Summary
Celestia (TIA) is positioned for significant growth over the next several years, driven by its leadership in modular blockchain data availability and increasing on-chain activity. Prices are expected to rebound from current lows in 2025, with strong upside potential through 2029 amid adoption tailwinds. However, market cycles, competition, and regulatory factors could introduce volatility, leading to consolidation periods by 2031. The wide projected ranges reflect both bullish and bearish market scenarios.
Key Factors Affecting Celestia Price
- Adoption of modular blockchains and rollup ecosystems leveraging Celestia's DA layer
- Sustained increase in blob sizes and transaction volumes, especially from NFT and new project integrations
- Decreasing data posting costs improving network utility and user growth
- Competition from other data availability solutions and L1/L2 chains
- Broader crypto market cycles, liquidity, and investor sentiment
- Potential regulatory developments affecting DA layers or crypto infrastructure
- Technological upgrades and protocol improvements enhancing scalability and security
Disclaimer: Cryptocurrency price predictions are speculative and based on current market analysis. Actual prices may vary significantly due to market volatility, regulatory changes, and other factors. Always do your own research before making investment decisions.
For example, if TIA experiences outsized volatility compared to relatively stable blob prices - as seen during periods of broad crypto weakness or project-specific news - this could represent an arbitrage window or signal an impending shift in demand for data blobs.
“Blobspace volatility is often the first sign of shifting sentiment among rollup developers. ”
This multi-layered approach allows savvy traders not only to analyze Celestia data blobs but also to anticipate where capital might flow next within the ecosystem.
4. Monitor Celestia Network Upgrades and Roadmap Developments
Staying ahead in blob trading means more than just watching price charts. Protocol upgrades, data availability (DA) improvements, and roadmap milestones can have a dramatic effect on blob demand and pricing. For example, recent upgrades that reduced posting costs from $0.30 to $0.07 per mebibyte have made Celestia more attractive for high-volume projects, fueling the surge in both blob size and transaction count.
To keep your edge sharp, follow official Celestia announcements and deep-dive research from sources like Bankless or Delphi Digital. These updates often precede major market moves, as integrations (like RARI chain or new NFT launches) can rapidly shift the economics of blobspace utilization. When a new rollup joins the network or a change in DA protocol is announced, blob pricing dynamics can pivot overnight, so treat these signals as early warnings for rebalancing your strategy.

5. Set Automated Alerts for Key Blob Market Events
With so much activity happening at breakneck speed, manual monitoring is no longer enough for serious data traders. Blobspace Markets’ alert system lets you set custom notifications for significant price swings, volume spikes, or changes in blobspace utilization. This means you’ll never miss a critical event, whether it’s an unexpected surge in NFT minting or a sudden drop in liquidity across key pools.
For example, if average daily blobs suddenly jump beyond their 11.4 GB baseline or TIA price ($1.39) veers off its usual correlation with blob prices, an automated alert gives you the chance to act before the rest of the market catches up. In fast-moving markets like Celestia’s, these split-second advantages add up over time.
Top Five Automated Alerts for Celestia Data Traders
- Utilize Real-Time Blob Market Analytics on Blobspace Markets: Leverage Blobspace Markets' live dashboards to monitor blob price fluctuations, trading volumes, and liquidity pools. This enables you to identify actionable insights as blob pricing and demand shift rapidly across the Celestia ecosystem.

- Apply Technical Analysis Tools from TradingView Integrated with Blobspace Markets: Use TradingView indicators—such as RSI, MACD, and moving averages—directly within Blobspace Markets to spot entry and exit points for blob trades based on historical price patterns.
- Track Macro Celestia (TIA) Price Movements and Correlate with Blob Pricing: Regularly compare TIA token price trends (currently $1.39) against blob market data to identify correlations and anticipate pricing shifts that may affect trading strategies.
- Monitor Celestia Network Upgrades and Roadmap Developments: Stay updated on protocol changes or DA (Data Availability) improvements via Delphi Digital reports and Celestia's official channels, as these can significantly impact blob demand and pricing dynamics.
- Set Automated Alerts for Key Blob Market Events: Use Blobspace Markets’ alert system to receive notifications for significant price swings, volume spikes, or changes in blobspace utilization, ensuring you can react swiftly to market-moving events.
Connect the Dots: Building Your Blob Trading Edge
The most successful traders don’t rely on any single metric, they synthesize real-time analytics, technical patterns, macro TIA price action, protocol news, and instant alerts into a cohesive strategy. By leveraging all five tools above through Blobspace Markets and trusted research sources, you’re equipped to spot opportunity amid chaos and defend against sudden drawdowns.
Key Takeaway: In today’s environment, where daily transactions are rising past 71,000 and average blobs eclipse 11 GB, the ability to analyze Celestia blob pricing trends with precision is what separates top performers from the pack.
If you want to stay ahead of the next big spike, or shield yourself from sudden reversals, make these five strategies your go-to playbook for navigating Celestia’s evolving blobspace market.


No comments yet. Be the first to share your thoughts!