
Celestia is rewriting the rules of blockchain data availability, and if you’re a developer eager to ride the next wave of onchain innovation, understanding Celestia data blob market trends is non-negotiable. In the last year, Celestia has rapidly outpaced Ethereum in daily data posted, driven by explosive NFT activity and rollup integrations. The numbers are eye-popping: as of September 23,2025, Celestia averages 26 GB of data posted per day compared to Ethereum’s 2.5 GB. Meanwhile, blob sizes have surged tenfold in recent months - a clear sign that demand for scalable, low-cost data posting is heating up.
How to Read Celestia Data Blob Market Trends
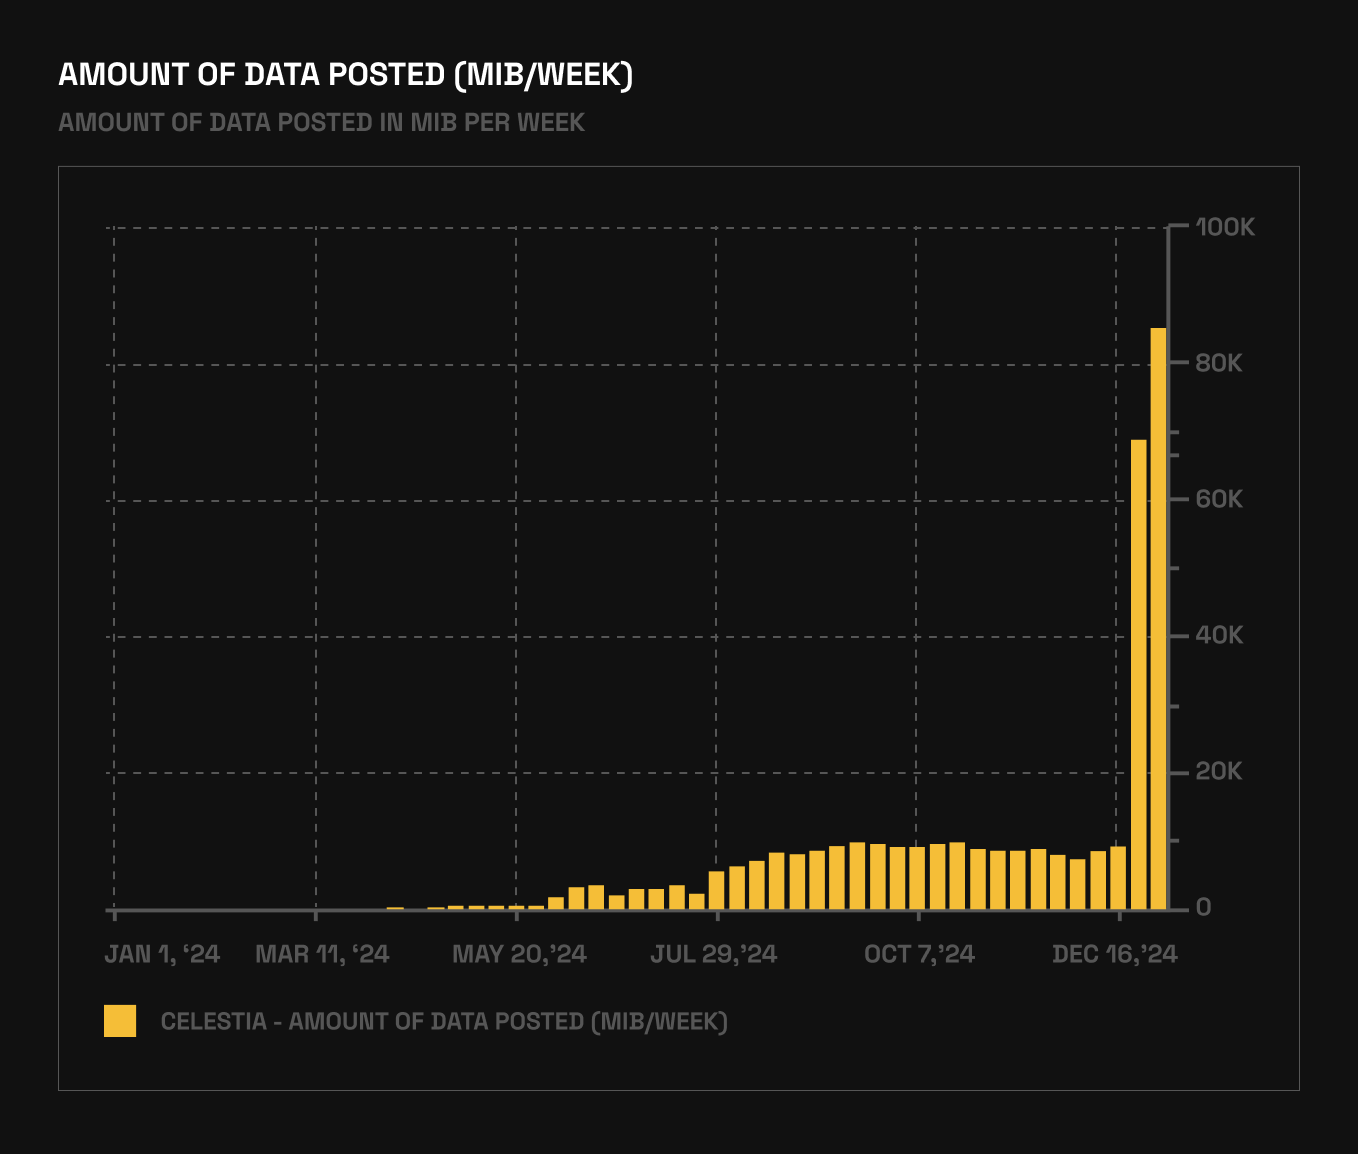
The first step in mastering Celestia blobspace analytics is tracking the right metrics. Blob size and transaction volume are your north stars. For example, between June and December 2024, average blob size was just 1.18 GB; but over two weeks this summer, it rocketed to 11.4 GB as NFT mints like Mammoth Overlord on Forma and new rollup launches (notably Eclipse) drove usage sky-high. Daily transactions jumped from an average of 44,000 to over 71,000 in that same period (source).
This kind of spike isn’t just noise - it signals real adoption by dApps hungry for affordable data availability. Developers should watch for:
- Sustained increases in blob sizes: Indicates growing demand from high-throughput apps or L2s.
- Sudden transaction surges: Often tied to major NFT events or protocol launches.
- Error/revert rates: High error rates can reveal network congestion or integration friction.
Blob Pricing Dynamics: What Developers Need to Know Right Now
The economics of storing data on Celestia are changing fast - and they’re changing in your favor. As of today, the cost to post a mebibyte is $0.07, down over 75% since November 2024 (source). This dramatic reduction has made it feasible for projects like RARI chain and Eclipse L2 to flood the network with blobs without breaking the bank.
If you’re analyzing Celestia blob pricing, keep these points front-and-center:
- Cost predictability unlocks new app designs: Rollups can now accurately model their operating expenses around stable blob prices.
- Drops in price often precede usage spikes: Lower costs attract more integrations and rapid experimentation.
- TIA token price doesn’t always track network usage: For instance, TIA currently trades at $1.49 - down 41% since December despite record demand for blobs (source). Don’t confuse token volatility with declining adoption!
The upshot? For developers building on modular blockchains or launching rollups, tracking both blob pricing trends and demand-side metrics helps you optimize deployment timing and budget planning.
Celestia (TIA) Price Prediction 2026-2031
Professional outlook based on current market dynamics, adoption trends, and competitive positioning in the data availability sector.
| Year | Minimum Price | Average Price | Maximum Price | Year-over-Year % Change (Avg) | Market Scenario Insights |
|---|---|---|---|---|---|
| 2026 | $1.10 | $1.65 | $2.40 | +11% | Continued adoption by new rollups and NFT projects supports moderate growth; downside risk if blob activity is mostly speculative. |
| 2027 | $1.05 | $2.10 | $3.20 | +27% | Mainstream modular blockchain adoption accelerates, but competition from other DA layers increases volatility. |
| 2028 | $0.95 | $2.60 | $4.00 | +24% | Regulatory clarity and further integration in DeFi/NFT sectors drive usage; bear scenario if network fails to attract real economic activity. |
| 2029 | $1.20 | $3.25 | $5.10 | +25% | Celestia cements its leadership in data availability, but macro market cycles introduce price swings. |
| 2030 | $1.60 | $4.10 | $6.40 | +26% | Widespread adoption of modular blockchains and Layer 2s boosts demand; possible bull run if crypto markets are strong. |
| 2031 | $2.10 | $5.00 | $8.20 | +22% | Strong network effects and ecosystem development could push TIA to new highs; downside capped by utility demand. |
Price Prediction Summary
Celestia (TIA) is positioned to benefit from the modular blockchain trend and the growing demand for scalable data availability solutions. While short-term performance may remain volatile due to market cycles and competition, the long-term outlook is optimistic if adoption continues and real-world use cases expand. Bullish scenarios see TIA reaching above $8 by 2031, while bearish cases are cushioned by the network's growing utility and competitive pricing.
Key Factors Affecting Celestia Price
- Rapid growth in data blob sizes and transaction volume, especially from NFT and Layer 2 integrations.
- Reduction in data posting costs increases competitive advantage over Ethereum and others.
- Potential for regulatory changes impacting the DA sector and token economics.
- Competition from other data availability solutions could limit upside.
- Celestia's ability to attract real economic activity versus spam or speculative use.
- Macro crypto market cycles and investor sentiment.
- Further technological improvements or roadmap developments (e.g., scalability, developer tools).
Disclaimer: Cryptocurrency price predictions are speculative and based on current market analysis. Actual prices may vary significantly due to market volatility, regulatory changes, and other factors. Always do your own research before making investment decisions.
The Role of Analytics Dashboards and Developer Tools in Blobspace Markets
You don’t need to be a data scientist to decode Celestia’s market pulse - but you do need the right tools! Modern dashboards like Blockworks’ analytics suite let you dissect:
- Blob transaction histories: Identify which rollups are pushing volume spikes or dominating bandwidth.
- Error/revert logs: Spot patterns that could affect your dApp’s reliability or user experience.
- User engagement metrics: See which apps are gaining traction versus those posting spammy or low-value blobs.
This granular visibility empowers devs to make informed choices about when (and where) to deploy their protocols for maximum impact.
But don’t stop at the dashboard, dig deeper with purpose-built blockchain developer tools for Celestia. Tools like Blobspace Markets provide real-time blob trading volume, historical pricing charts, and granular analytics on which projects are driving demand. With these insights, you can benchmark your own dApp’s activity against the broader ecosystem and identify emerging opportunities before the crowd.
Top 5 Tools for Analyzing Celestia Blobspace Trends
- Celestia Explorer: The official block explorer for Celestia, offering real-time visualization of blob transactions, block production, and network activity. Essential for tracking blob sizes, transaction spikes, and rollup integrations.

- Blockworks Celestia Analytics Dashboard: A comprehensive analytics suite that provides in-depth metrics on blob usage, transaction volumes, and revert errors, helping developers identify network trends and app growth.
- The Block Data Terminal: Industry-leading analytics platform featuring up-to-date statistics on Celestia’s daily data throughput, blob market share, and comparative analysis with Ethereum and other data availability layers.
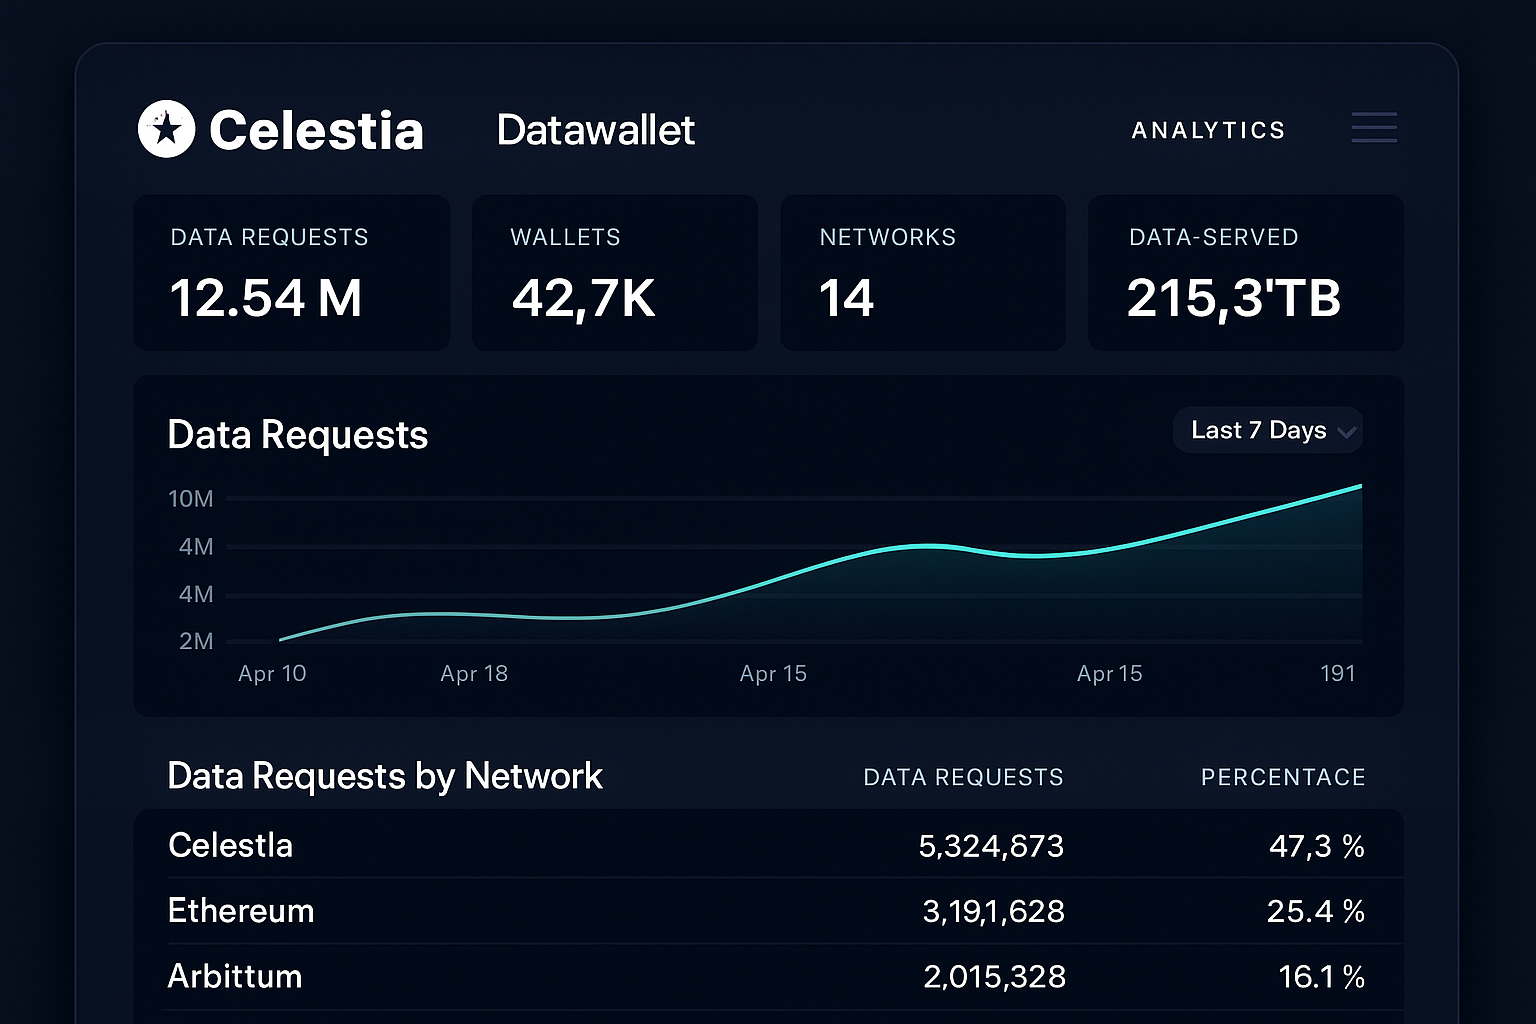
- Celestia Datawallet: A data aggregation tool that leverages Datawallet’s infrastructure to deliver insights on Celestia’s blob production, data availability sampling, and network adoption trends across rollups and NFT projects.
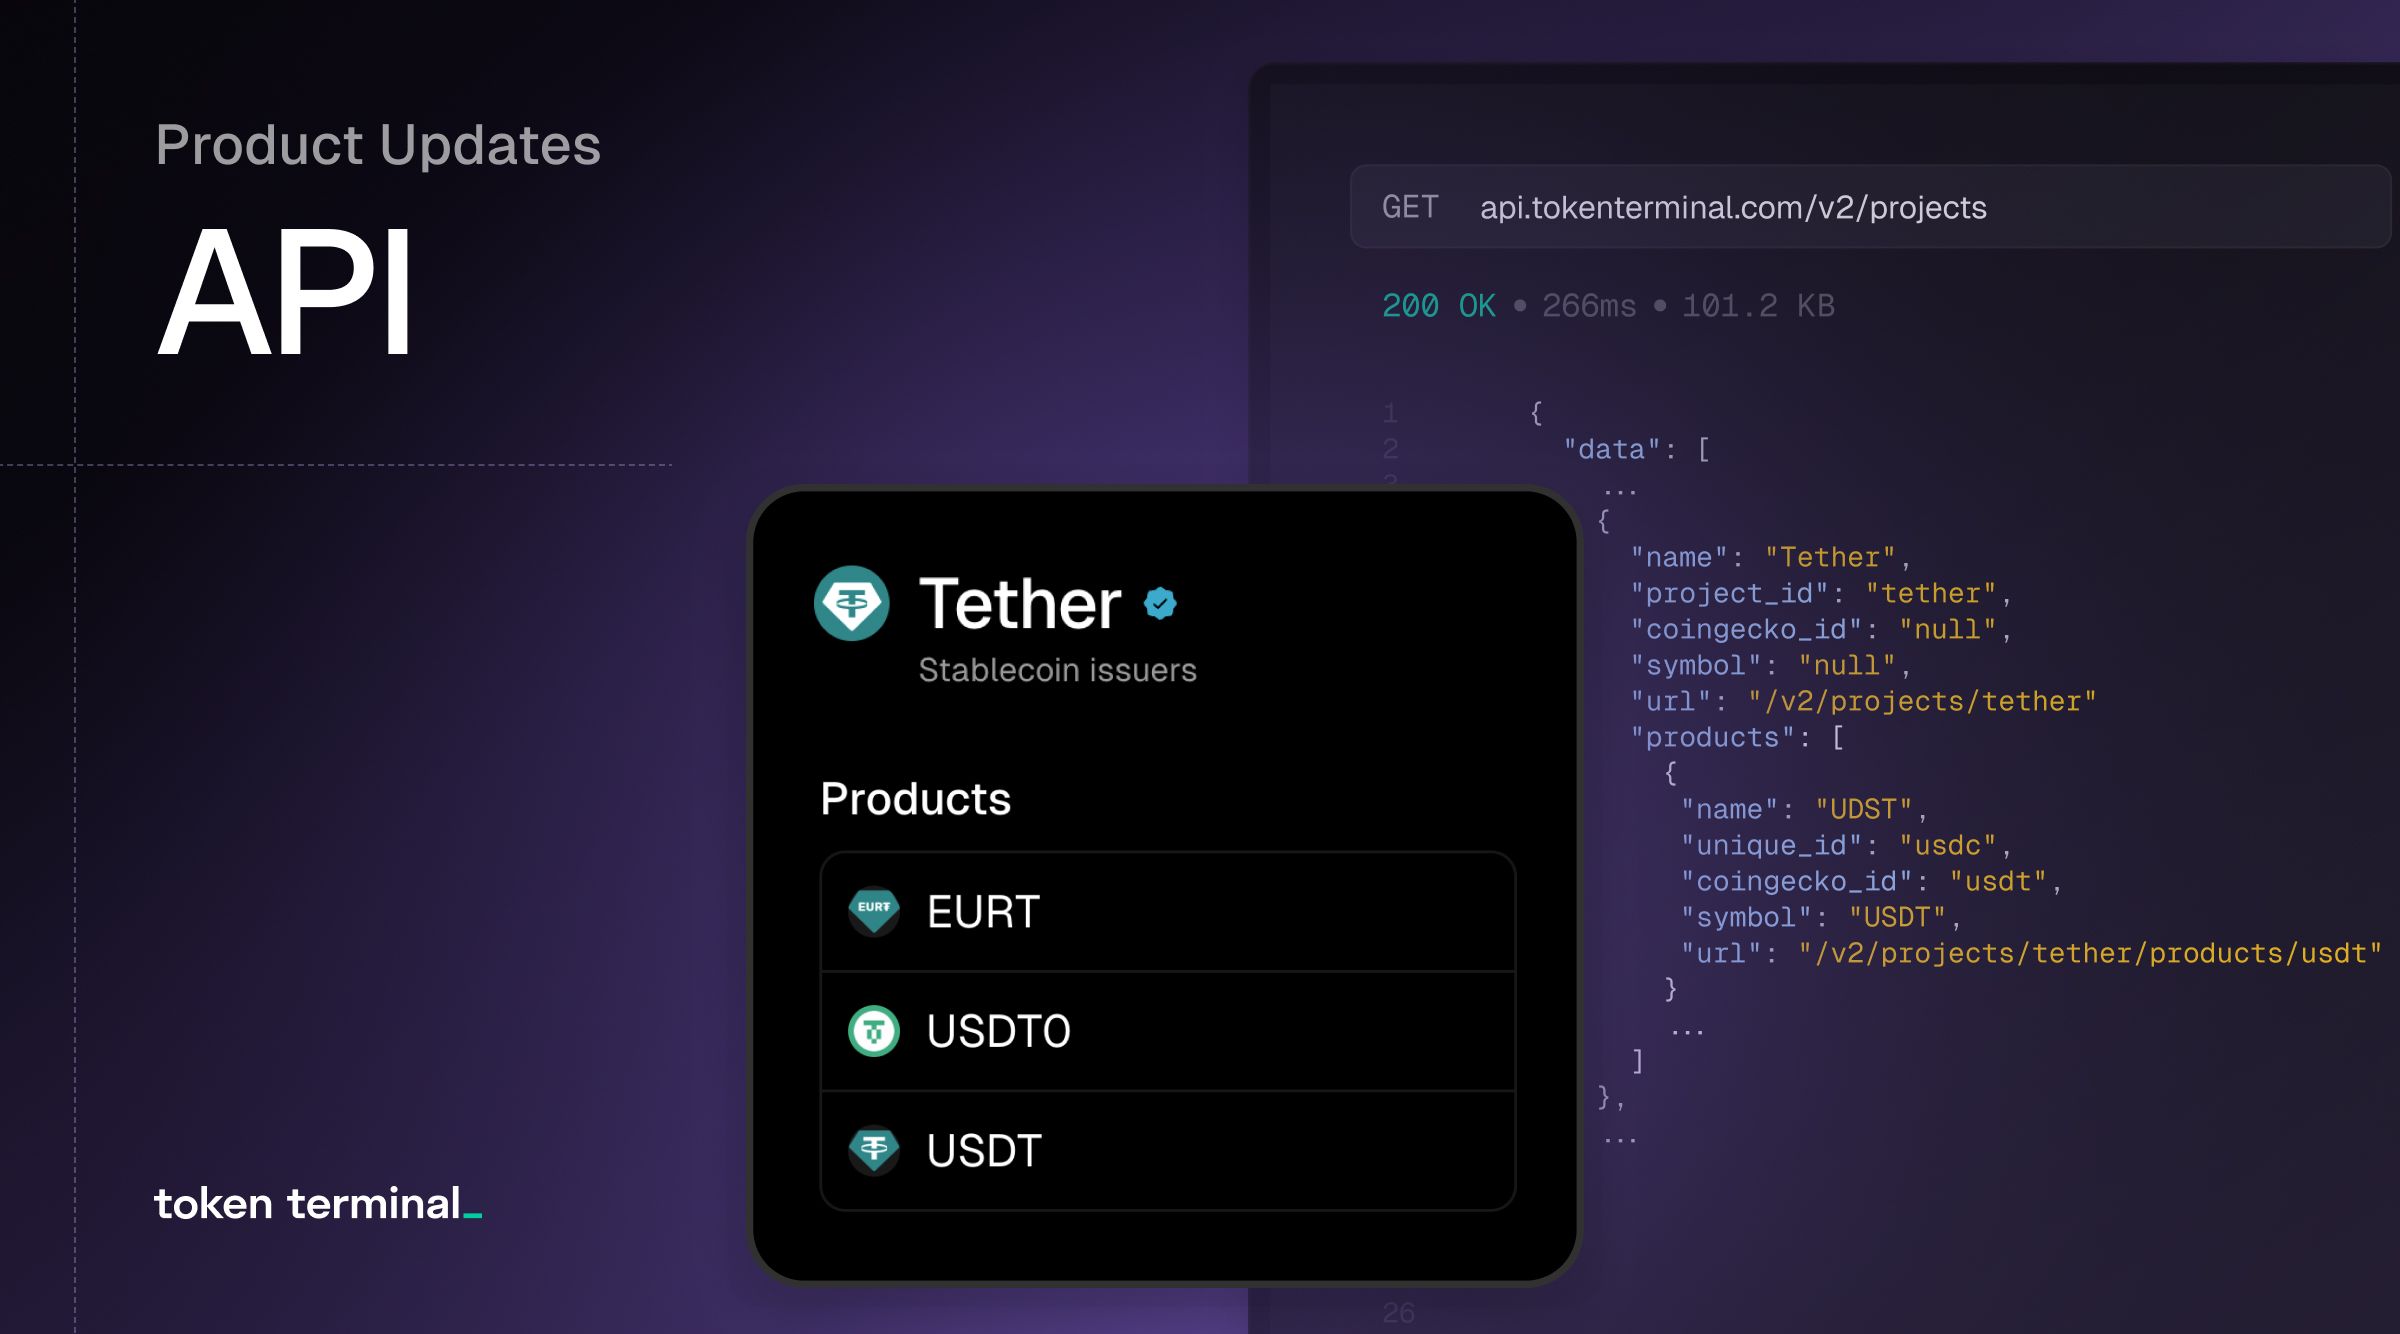
- Token Terminal: Widely used by blockchain developers to monitor protocol financials, Token Terminal tracks Celestia’s key performance indicators, including blob posting costs, transaction fees, and TIA token metrics (currently priced at $1.49 as of September 23, 2025).
Here’s what separates advanced developers from the rest: they combine on-chain analytics with off-chain context. For example, when you see a sudden spike in blob trading volume or a dip in posting costs, cross-reference it with community chatter or protocol announcements. This helps you distinguish between organic growth and one-off events like NFT mints or testnet spam.
Spotting Patterns: How to Turn Data Into Actionable Insights
Let’s get practical. Suppose you notice that daily blob volumes are rising while error rates remain low and costs are steady at $0.07 per mebibyte. That’s a green light for launching bandwidth-intensive features, think gaming rollups or high-frequency DeFi apps. On the flip side, if network congestion is spiking alongside big NFT mints, consider timing your deployment for quieter periods to minimize costs and maximize reliability.
Keep an eye on Celestia’s integration pipeline too. When new chains like Eclipse or RARI plug into Celestia for data availability, it often triggers secondary waves of adoption as developers flock to proven infrastructure. Monitoring these integrations gives you a head start on positioning your own project in front of fresh liquidity and users.
Key Takeaways for Developers Navigating Celestia Blobspace
The modular blockchain era rewards devs who move fast but think strategically. Here’s how to stay ahead:
- Track both macro and micro trends: Daily blob size and transaction surges reveal broad adoption; granular error logs help you fine-tune deployments.
- Don’t anchor on token price alone: TIA at $1.49 doesn’t tell the whole story, usage metrics matter more for long-term builders.
- Leverage analytics dashboards: Use real-time tools to spot volume leaders, cost anomalies, and new rollup launches.
- Time your deployments: Launch during low-cost windows and after major network upgrades to optimize budget and performance.
The bottom line? The Celestia data blob market is evolving at warp speed. By mastering blobspace analytics now, you’ll be ready to capture value as data availability becomes the next frontier in decentralized tech. Stay curious, keep experimenting, and remember: momentum is your friend!


No comments yet. Be the first to share your thoughts!