
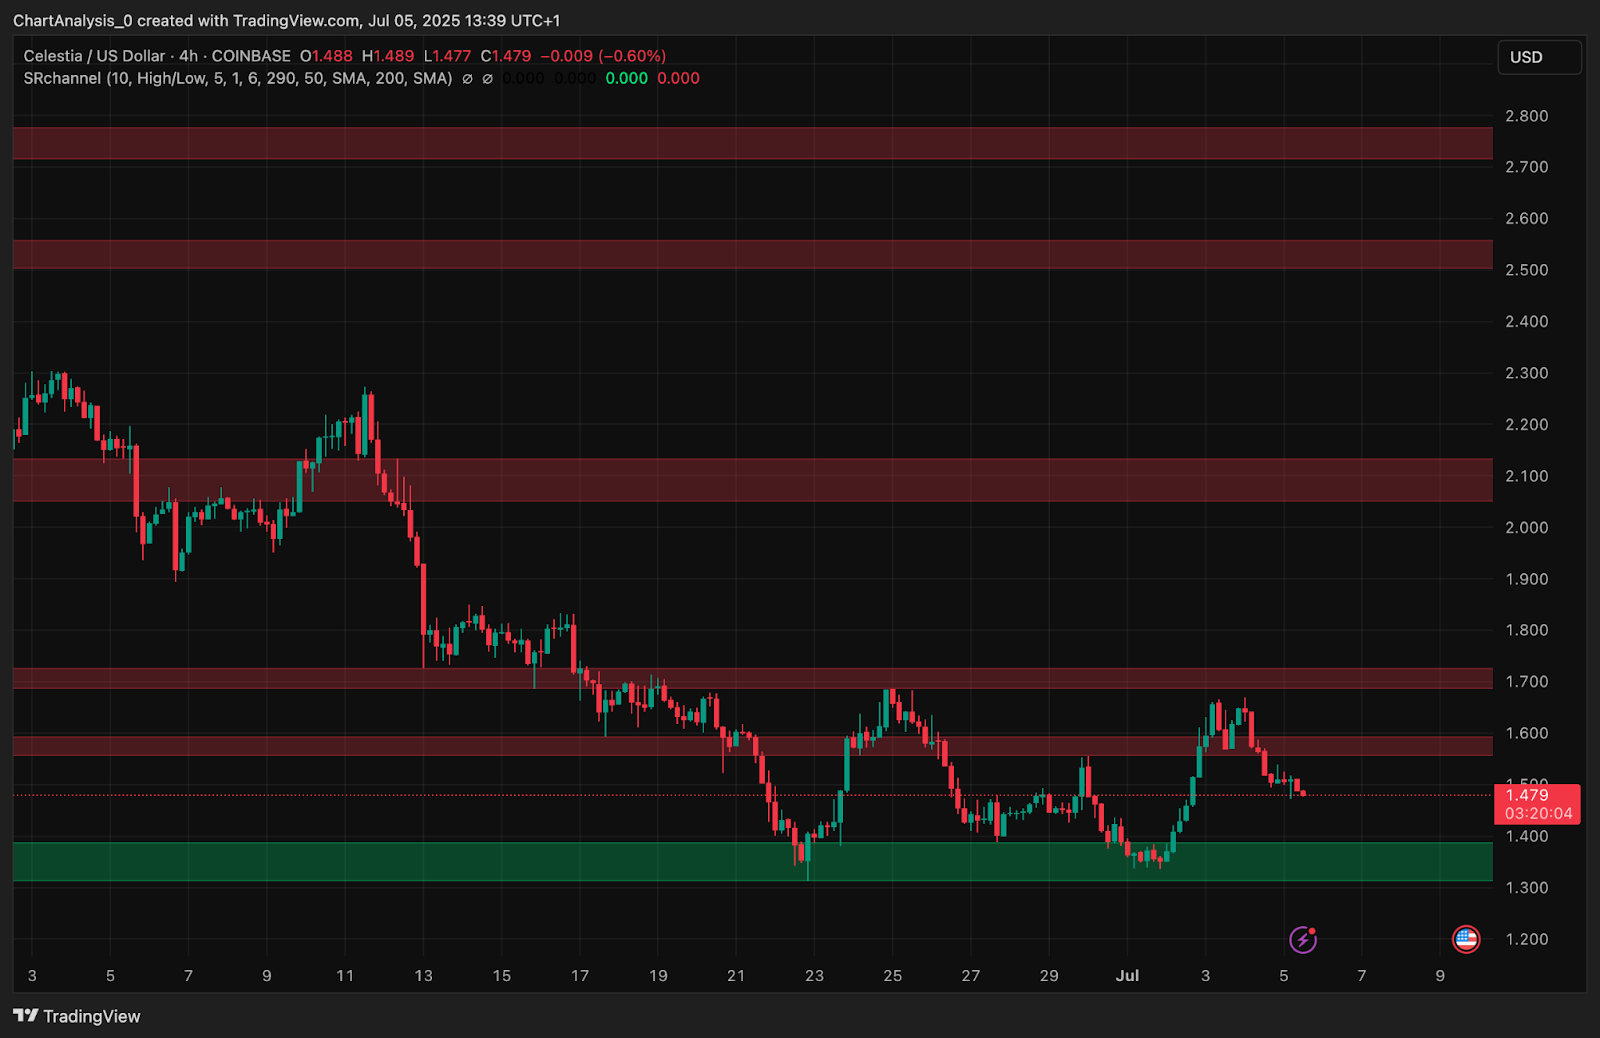
In the fast-evolving Celestia ecosystem, analyzing real-time blob market pricing trends is essential for developers, traders, and data scientists seeking an edge. The current state of the market is marked by high volatility and a surge in both blob sizes and transaction volumes. With Celestia (TIA) trading at $1.50 (down 11.77% over 24 hours), understanding the drivers behind these rapid changes is critical for informed decision-making.
Celestia Blob Market Dynamics: The Impact of Surging Usage
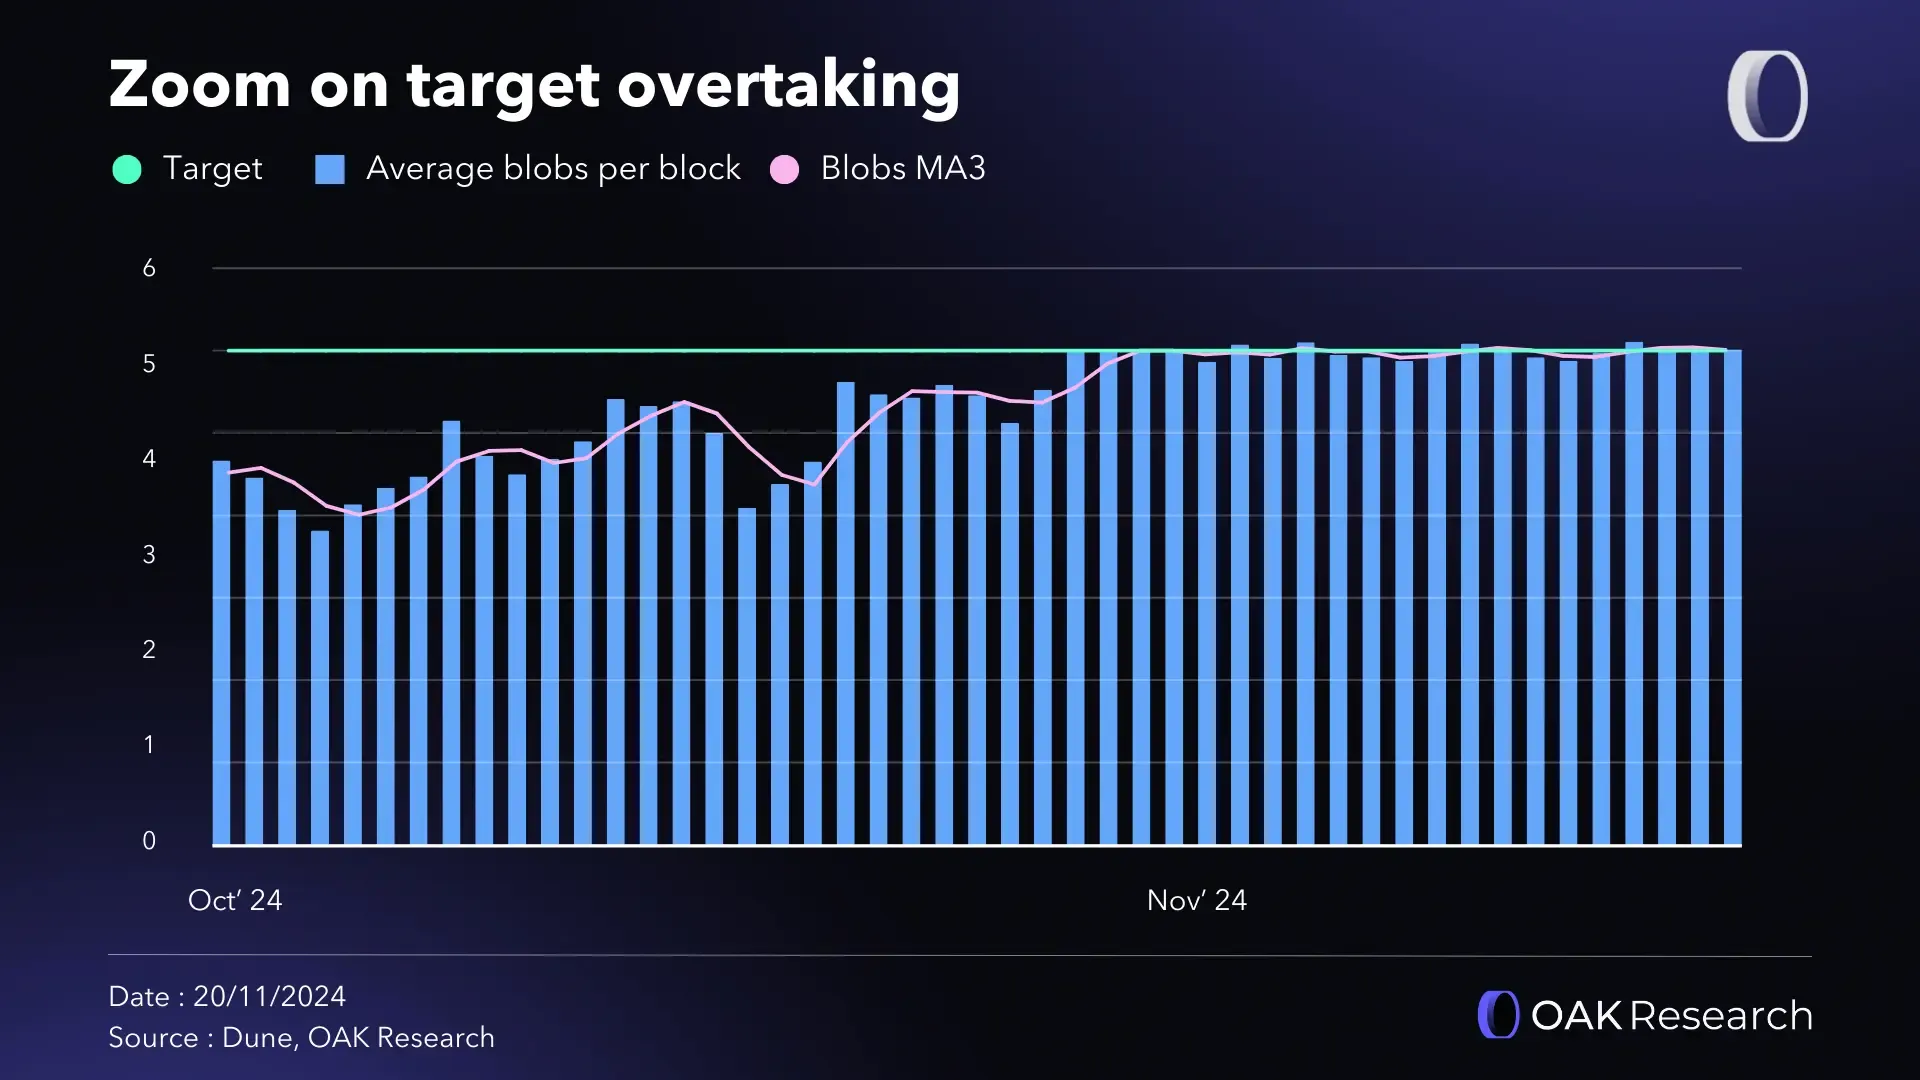
The last quarter has seen a remarkable transformation in the Celestia blobspace landscape. According to recent analytics, average blob size has soared from 1.18 GB to 11.4 GB in just two weeks, a nearly tenfold increase (source). This spike aligns with a 60% and jump in daily transactions, now averaging 71,000 per day compared to 44,000 previously. These figures are not just statistical outliers, they represent fundamental shifts in network demand, largely driven by intensified NFT minting activity and new projects leveraging Celestia as their data availability layer.
The Eclipse rollup’s integration with Celestia has been a major catalyst here, pushing both throughput and demand for blobspace to new highs (source). In this environment, real-time analytics are indispensable for capturing microstructure movements that can impact pricing within minutes.
Spotlight on Real-Time Pricing: Key Metrics and Tools
To navigate the volatility of the Celestia blob market, traders rely on a suite of analytics tools that offer granular visibility into both price and usage trends. The most actionable metrics include:
- Blob Size Distribution: Tracking average vs. outlier blobs reveals congestion risks and fee spikes.
- Transaction Throughput: Higher throughput often correlates with increased competition for blobspace, influencing short-term pricing.
- Fee Rate Volatility: Subsidized fees can mask true demand; sudden changes signal shifts in market equilibrium.
- TIA Price Action: With TIA at $1.50, price sensitivity to network usage is heightened as narrative-driven speculation gives way to utility-based value.
The Celestia Analytics Dashboard provides real-time tracking of these metrics across core functions, blobspace utilization, financials, staking stats, enabling users to react swiftly as new data arrives.
TIA Price at $1.50: What Does It Signal for Blob Valuation?
The current TIA price of $1.50, alongside its sharp daily drop, reflects heightened uncertainty around whether data availability (DA) is evolving into a true commodity or remains speculative (source). As subsidized fees phase out over time and organic demand grows, especially from Ethereum L2s seeking scalable DA solutions, the linkage between TIA price action and underlying blob utility will only intensify.
Celestia (TIA) Price Prediction 2026-2031
Professional Forecasts Based on Real-Time Network Metrics, Market Trends, and Adoption Scenarios
| Year | Minimum Price (Bearish) | Average Price (Base Case) | Maximum Price (Bullish) | Year-over-Year Change (Avg) |
|---|---|---|---|---|
| 2026 | $1.10 | $1.90 | $3.40 | +27% |
| 2027 | $1.00 | $2.20 | $4.10 | +16% |
| 2028 | $0.85 | $2.80 | $5.60 | +27% |
| 2029 | $0.80 | $3.30 | $7.20 | +18% |
| 2030 | $0.75 | $3.90 | $8.50 | +18% |
| 2031 | $0.70 | $4.60 | $10.20 | +18% |
Price Prediction Summary
Celestia (TIA) is positioned as a leading modular data availability (DA) solution, with recent surges in blob size usage and transaction volumes reflecting heightened network demand. While the current price action is bearish due to macro pressures and speculative overhang, the long-term outlook remains positive if Celestia sustains adoption among rollups and L2s. The base case projects steady year-over-year growth as the network matures, with volatility reflected in the wide min/max ranges. Bullish outcomes depend on continued technical innovation and increased DA demand from the Ethereum and broader modular ecosystem. Bearish scenarios could play out if DA commoditization intensifies or network economics fail to support token value.
Key Factors Affecting Celestia Price
- Rapid increase in blob size and transaction volume, signaling growing network utility and adoption.
- Celestia's DA layer remains significantly cheaper than Ethereum, attracting L2/L3 projects.
- Current price is heavily influenced by narrative and future expectations rather than realized demand.
- Potential for fee market maturity and sustainable token demand as more rollups integrate Celestia.
- Regulatory clarity on DA tokens and broader crypto assets could impact investor confidence and institutional participation.
- Competitive pressure from alternative DA solutions and Ethereum's own scaling roadmap.
- Tokenomics and staking dynamics, including inflation and rewards, will affect circulating supply and price stability.
- Market cycles, including potential global crypto bull/bear cycles, may amplify or dampen price trends.
Disclaimer: Cryptocurrency price predictions are speculative and based on current market analysis. Actual prices may vary significantly due to market volatility, regulatory changes, and other factors. Always do your own research before making investment decisions.
This transition period creates both risk and opportunity for active participants. Those who monitor real-time shifts in transaction volume, fee rates, and blob size distribution are best positioned to anticipate inflection points before they’re reflected in broader market sentiment or token price.
Navigating Volatility: Strategies for Real-Time Blob Market Analysis
The current environment demands agility and precision from anyone trading blobs or speculating on TIA’s future value proposition. Here’s where specialized analytics platforms like Blobspace Markets excel, providing up-to-the-minute insights into market depth, order book imbalances, and emerging patterns across the network’s modular stack.
Which metric do you consider most important when analyzing real-time Celestia blob markets?
Celestia's blob sizes and transaction volumes have surged recently, with the average blob size jumping nearly 10x and daily transactions up over 60%. As the network evolves, which metric do you rely on most to gauge market health and trends?
One of the most actionable approaches in this landscape is to combine quantitative order flow analysis with real-time monitoring of blobspace congestion. When blob sizes spike - as seen in the recent surge to 11.4 GB - and fee volatility increases, traders should watch for rapid shifts in the bid-ask spread for blobs and TIA pairs. These microstructure signals often precede broader price movements, especially during periods of heightened NFT minting or when new rollups like Eclipse ramp up their activity.

The cost advantage of Celestia’s DA layer remains a core narrative for both developers and investors. With data availability costs at $7.31 per MB on Celestia compared to $20.56 on Ethereum (source), there is a clear economic incentive driving adoption from L2s and novel dApps. However, as network usage expands, these pricing dynamics are subject to change - making real-time analytics not just useful but essential for anyone seeking alpha.
Essential Tools: Optimizing Your Blob Market Workflow
To stay ahead in the Celestia blob market analysis, leverage these core tools and strategies:
Top 5 Analytics Tools for Celestia Blob Pricing Trends
- Blockworks Celestia Analytics Dashboard: This dashboard offers real-time insights into Celestia's blobspace usage, pricing trends, and network activity. It tracks metrics like average blob size, transaction volume, and cost per MB, helping users monitor the surge in blob sizes (now averaging 11.4 GB) and daily transactions (recently up to 71,000 per day).
- CryptoRank Celestia Price Analytics: CryptoRank provides comprehensive analysis of Celestia (TIA) price dynamics, quarterly returns, and annual trends. The platform enables users to correlate blob market trends with TIA’s current price of $1.50 and recent 24h changes (-11.77%), supporting data-driven trading decisions.
- Conduit Data Availability Cost Comparison: Conduit’s analytics compare Celestia blob pricing versus Ethereum blobs, showing that Celestia is 64% cheaper ($7.31/MB vs. $20.56/MB). This tool is essential for evaluating real-time cost efficiency as blob usage and transaction volumes rise.
- CoinMarketCap Celestia Market Data: CoinMarketCap aggregates real-time price, volume, and market cap data for Celestia (TIA). It also features news and trend analysis, enabling users to track the recent price drop to $1.50 and its impact on blob market activity.

- Numia Data Celestia DA Analytics: Numia Data’s platform offers in-depth reports on Celestia’s data availability layer, including blob fee market trends and throughput statistics. It’s particularly useful for analyzing how rollups like Eclipse are driving the recent spike in blob sizes and transaction volumes.

- Blobspace Utilization Charts: Identify bottlenecks and predict fee surges before they materialize on-chain.
- Fee Rate Trackers: Monitor both average and outlier transactions to spot arbitrage opportunities.
- Order Book Heatmaps: Visualize liquidity depth and detect imbalances that signal short-term price moves.
- Automated Alerts: Set triggers for key thresholds in blob size or TIA price to enable timely trades.
- Historical Correlation Analysis: Backtest relationships between network usage spikes, fee changes, and TIA/USD returns.
The interplay between subsidized fees, narrative-driven speculation, and actual demand creates a uniquely dynamic market structure. As noted by Delphi Digital (source), TIA’s current valuation is tethered more to future expectations than present utility - but this balance is shifting rapidly as real-world usage data accumulates.
From Data to Decisions: Actionable Insights for Traders and Builders
The recent drop in TIA’s value to $1.50, paired with a 54% decline in fully diluted valuation since early 2024 (source), underscores why it’s critical to anchor your strategy in data rather than hype cycles. Blobs are increasingly being treated as a commodity resource within modular blockchains; this means that trading strategies must account not only for token price but also for underlying network throughput, congestion risks, and evolving DA economics.
A robust approach might involve tracking rolling averages of blob size versus transaction count, then overlaying these with order book dynamics on Blobspace Markets or similar platforms. This enables proactive positioning ahead of major volatility events - whether they stem from protocol upgrades, L2 migrations, or sudden NFT launches.
The bottom line: In the current environment where Celestia (TIA) sits at $1.50, those who harness high-frequency data streams, advanced analytics tools, and an adaptive mindset are best equipped to seize opportunity amid uncertainty. As DA becomes more commoditized across chains, expect both risk premiums and profit potential in blob markets to rise accordingly.


No comments yet. Be the first to share your thoughts!