
Celestia’s modular architecture has propelled data availability (DA) into the spotlight, with blob transaction volume emerging as a critical metric for network health and market dynamics. As of September 2025, Celestia (TIA) is trading at $1.70, reflecting a modest 24-hour change of -0.0503%. But price alone tells only part of the story: the real pulse of Celestia’s ecosystem beats in its blobspace analytics.
Why Analyze Blob Transaction Volume on Celestia?
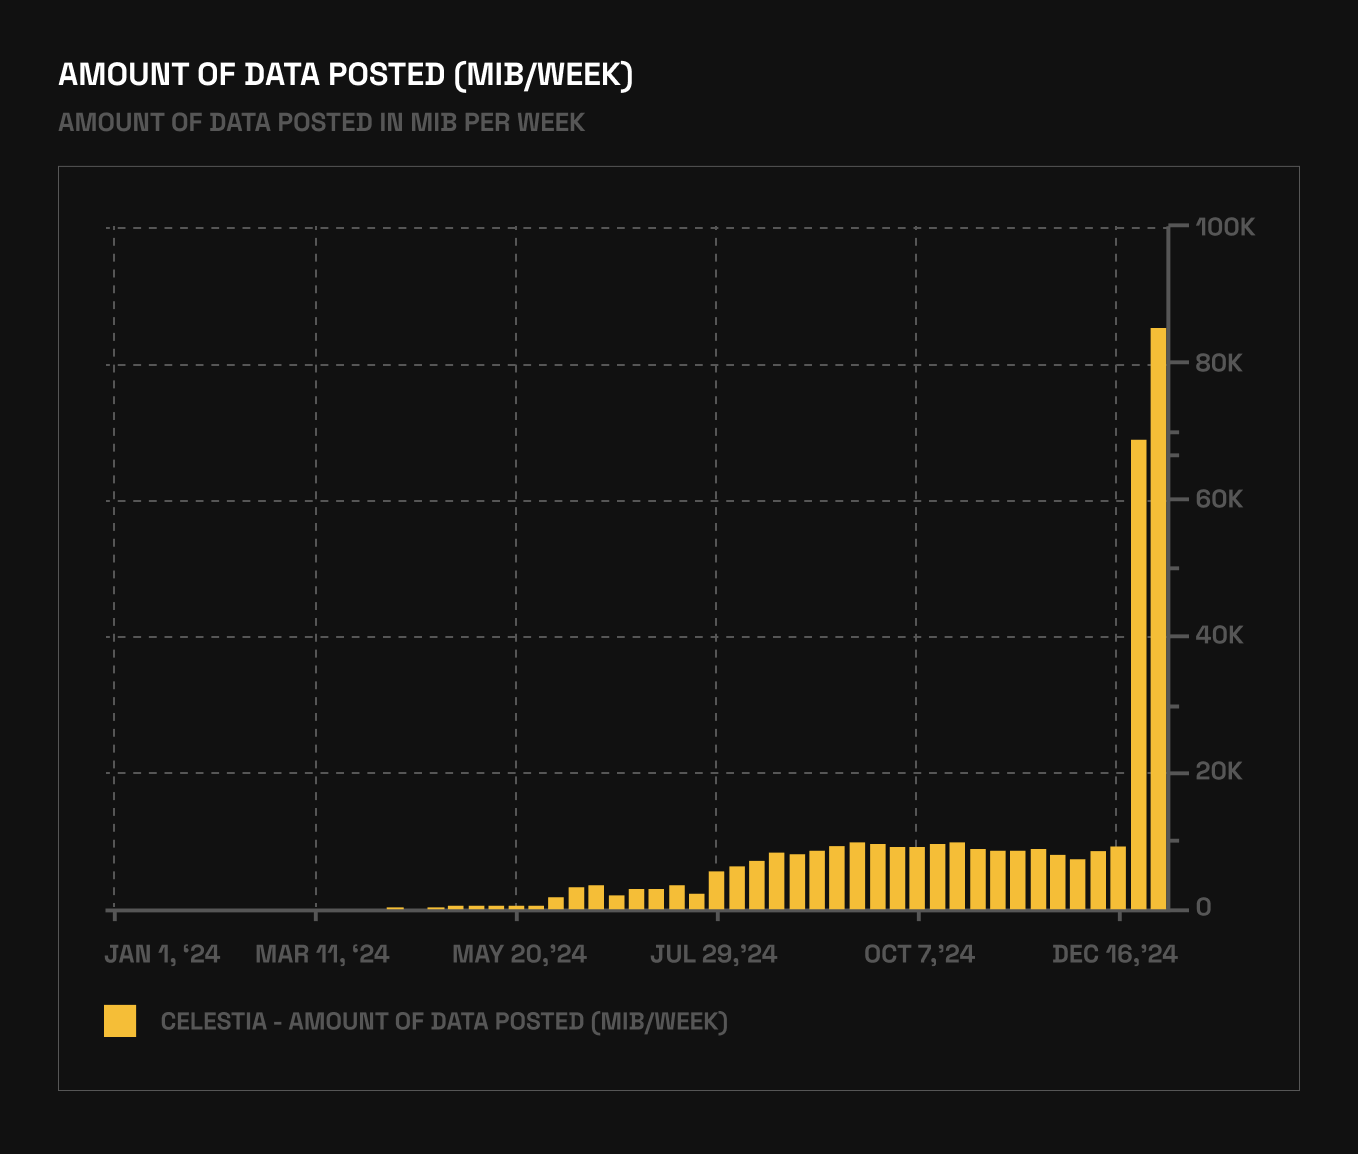
Blobs are the fundamental unit for off-chain data settlement on Celestia, underpinning everything from rollup scalability to NFT minting surges. By analyzing blob transaction volume, stakeholders can quantify network utilization, pinpoint periods of congestion or underuse, and correlate these trends with application adoption or fee volatility. In June-December 2024, for instance, average blob sizes increased nearly tenfold due to intensified activity from new projects leveraging Celestia’s DA layer (source). Such spikes drive both opportunity and risk for traders and developers alike.
Key Methods: Daily Blob Transaction Volume Tracking
Daily Blob Transaction Volume Tracking is the cornerstone metric for anyone seeking to analyze blob transaction volume on Celestia. This method involves monitoring the number of blob transactions (BlobTx) submitted each day. Each BlobTx comprises a MsgPayForBlobs Cosmos-SDK message alongside one or more blobs containing application data (docs.celestia.org). By aggregating daily counts, analysts can:
- Identify usage trends and detect sudden increases linked to new dApp launches or NFT drops
- Gauge user engagement across different timeframes
- Correlate transaction surges with fee fluctuations or network upgrades
This method provides a high-resolution view into how demand for blobspace evolves over time, feeding directly into broader market analytics.
Assessing Network Strain: Blobspace Utilization Rate
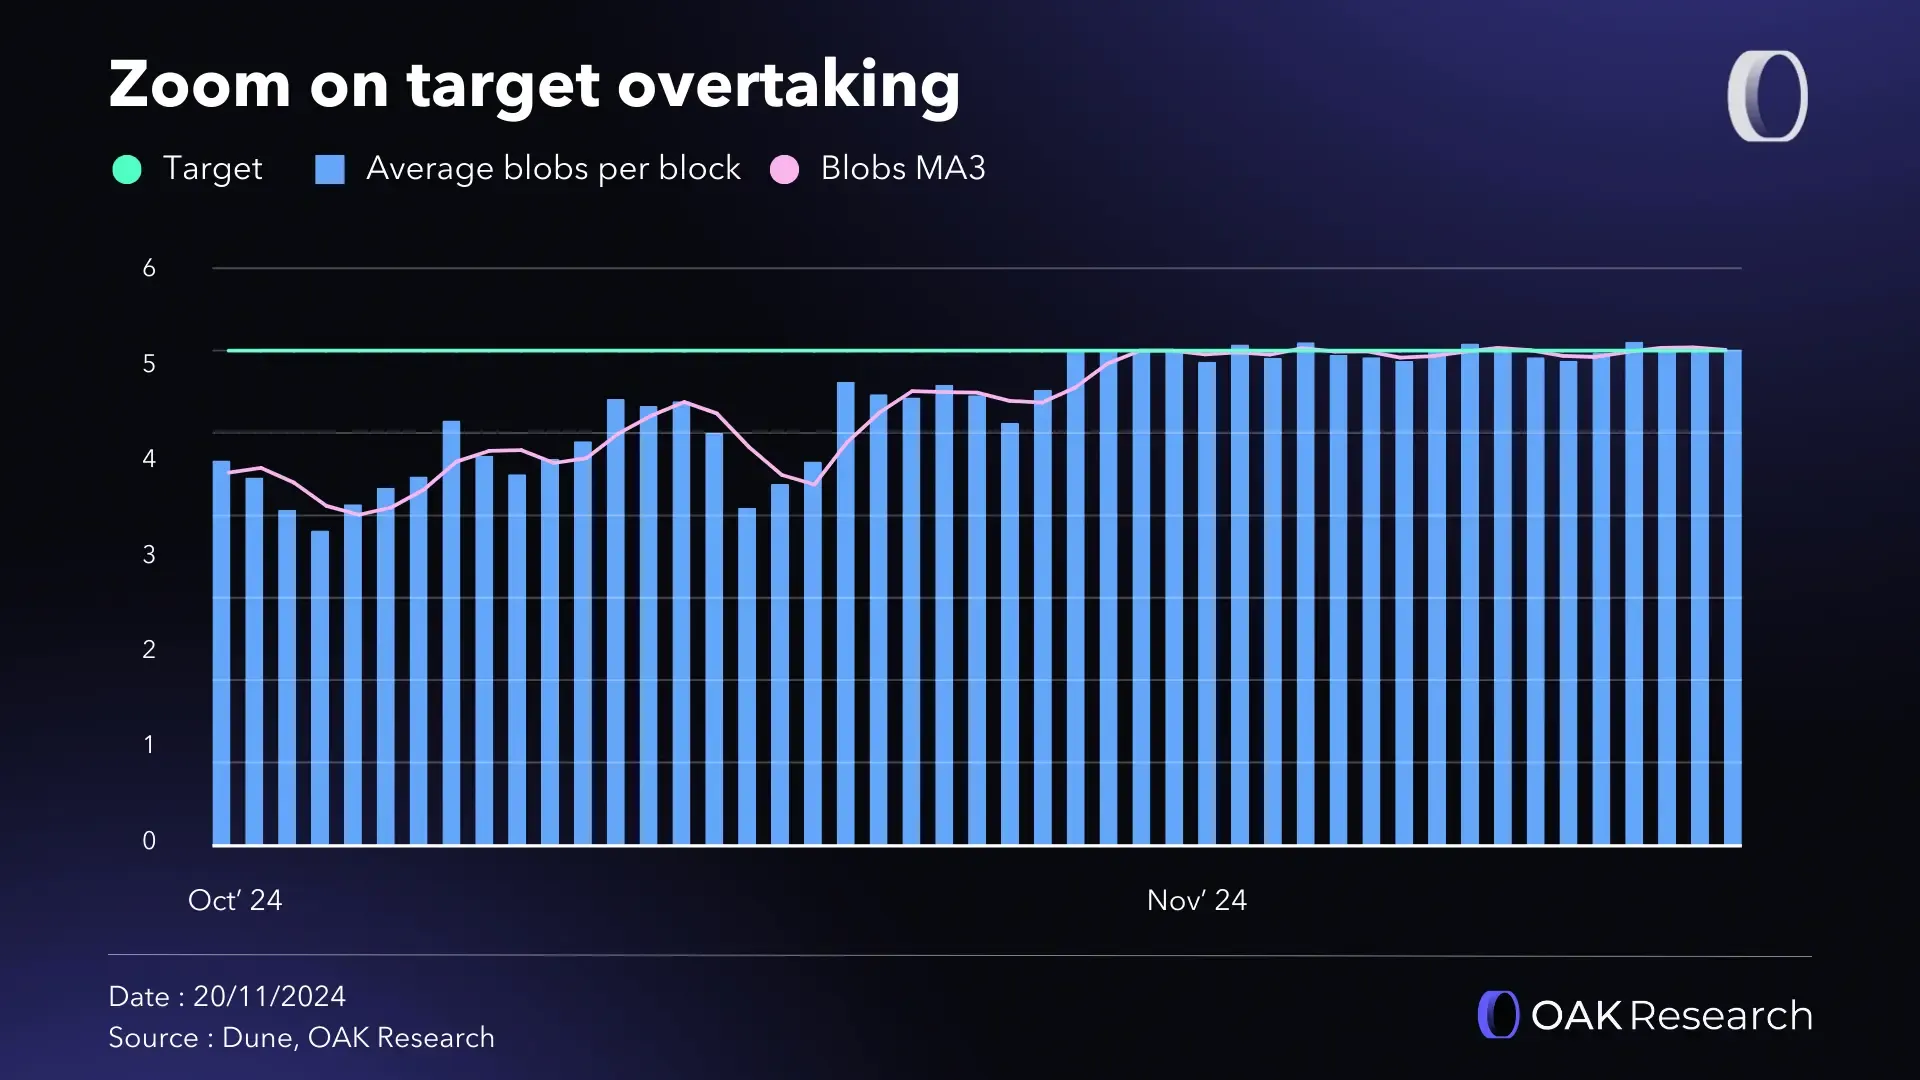
The second vital metric is the Blobspace Utilization Rate, which measures what percentage of Celestia’s maximum DA capacity is actively used at any given moment. This rate acts as an early warning system for congestion risk and fee pressure; when utilization approaches full capacity, competition for blob inclusion intensifies, often driving up costs in tandem with heightened user demand.
This metric also helps contextualize raw transaction counts by showing whether growth in activity is sustainable within current infrastructure limits or if scaling solutions may soon be required. Platforms like Blockworks’ analytics dashboard offer real-time visualizations of this utilization rate alongside other core metrics (blockworks.com). Regular monitoring enables users to:
- Compare current utilization against historical peaks and valleys
- Forecast potential bottlenecks before they impact user experience
- Inform trading strategies based on anticipated fee changes or throughput constraints
Essential Methods & Metrics for Celestia Blob Analysis
- Daily Blob Transaction Volume Tracking: Monitoring the total number of blob transactions submitted to Celestia each day is crucial for assessing network activity and adoption. Analytics dashboards like Blockworks Celestia Analytics provide real-time data on daily blob counts, transaction spikes, and historical trends, helping users identify periods of heightened usage or emerging application growth.
- Blobspace Utilization Rate (Percentage of Maximum DA Capacity Used): This metric measures how much of Celestia’s available data availability (DA) capacity is actively being used. By comparing total blob data submitted against the network’s maximum capacity, users can gauge network congestion, efficiency, and potential fee pressure. Platforms like Blockworks Celestia Analytics visualize blobspace utilization rates, offering insight into whether the network is approaching critical usage thresholds.
The Interplay Between Volume and Utilization in Market Analysis
The interaction between daily transaction volume and utilization rate offers deep insight into both technical health and economic opportunity within Celestia’s ecosystem. For example, if daily volume rises but utilization remains stable below capacity thresholds, it could signal efficient scaling by rollups or improved block space allocation policies. Conversely, simultaneous spikes in both metrics may indicate a tipping point where fees could rapidly escalate, a scenario explored in recent discussions about blobspace scarcity as bull markets return (conduit.xyz).
Celestia (TIA) Price Prediction 2026-2031
Professional Outlook Based on Blob Transaction Analytics and Market Trends (Baseline: $1.70 as of Sep 2025)
| Year | Minimum Price (Bearish) | Average Price (Base Case) | Maximum Price (Bullish) | % Change (Avg YoY) | Market Scenario |
|---|---|---|---|---|---|
| 2026 | $1.25 | $2.05 | $3.00 | +20.6% | Continued adoption, moderate market growth |
| 2027 | $1.10 | $2.55 | $4.20 | +24.4% | Major rollup integrations, increased blob usage |
| 2028 | $1.35 | $3.10 | $5.80 | +21.5% | High blobspace demand, DA layer competition rises |
| 2029 | $1.50 | $3.65 | $7.25 | +17.7% | Regulatory clarity, modular blockchain trend accelerates |
| 2030 | $1.85 | $4.20 | $8.90 | +15.1% | Celestia ecosystem matures, L2/L3 adoption peaks |
| 2031 | $2.10 | $4.80 | $10.30 | +14.3% | Sustained growth, potential for new data markets |
Price Prediction Summary
Celestia (TIA) is projected to see steady price appreciation through 2031, driven by increasing adoption of its data availability (DA) layer, higher blob transaction volumes, and broader rollup integration. While downside risks persist due to competition or regulatory headwinds, the overall outlook is positive, with average prices potentially reaching $4.80 by 2031. Bullish scenarios could see TIA exceeding $10 if Celestia solidifies its role as a leading modular DA solution.
Key Factors Affecting Celestia Price
- Blob transaction volume and network utilization growth
- Adoption by Ethereum L2s/L3s and other rollups
- Evolution of data availability technology and competition (e.g., EigenDA, Avail)
- General crypto market cycles (bull/bear phases)
- Regulatory clarity on DA and modular blockchain sectors
- Staking participation rates and tokenomics changes
- Expansion of Celestia ecosystem and developer activity
Disclaimer: Cryptocurrency price predictions are speculative and based on current market analysis. Actual prices may vary significantly due to market volatility, regulatory changes, and other factors. Always do your own research before making investment decisions.


No comments yet. Be the first to share your thoughts!