
The modular architecture of Celestia has propelled data blobs into the center of blockchain scalability and composability debates. As decentralized applications demand ever-greater throughput and verifiable data availability, understanding real-time blob activity is no longer a luxury but a necessity. Developers, analysts, and validators need actionable insights into blobspace usage, pricing trends, and network health to make informed decisions in this rapidly evolving ecosystem. At the time of writing, Celestia (TIA) is trading at $1.70, reflecting subtle 24-hour volatility and underscoring the importance of robust market analytics tools for tracking the pulse of blobspace dynamics.
Why Real-Time Blob Market Analytics Matter
Celestia’s data blobs are more than just raw throughput metrics; they are economic units that underpin rollup security, composability, and fee markets. As new applications push for higher data availability (DA), monitoring blob activity in real time helps identify bottlenecks, track network congestion, and anticipate fee spikes or market opportunities. The rise of sophisticated analytics platforms has enabled stakeholders to:
- Monitor live blob submissions across namespaces and rollups
- Visualize historical blobspace consumption to spot macro trends
- Correlate price movements with on-chain activity for trading or research purposes
- Diagnose validator performance and bridge node health in real time
- Archive critical data events for compliance or forensic analysis
This analytical rigor is especially vital as Celestia’s ecosystem welcomes a wave of next-generation apps requiring extreme DA throughput, a trend highlighted by industry observers such as @nickwh8te:
The Top 5 Real-Time Tools for Blob Market Analytics in 2025
Top 5 Real-Time Tools for Monitoring Celestia Blob Activity
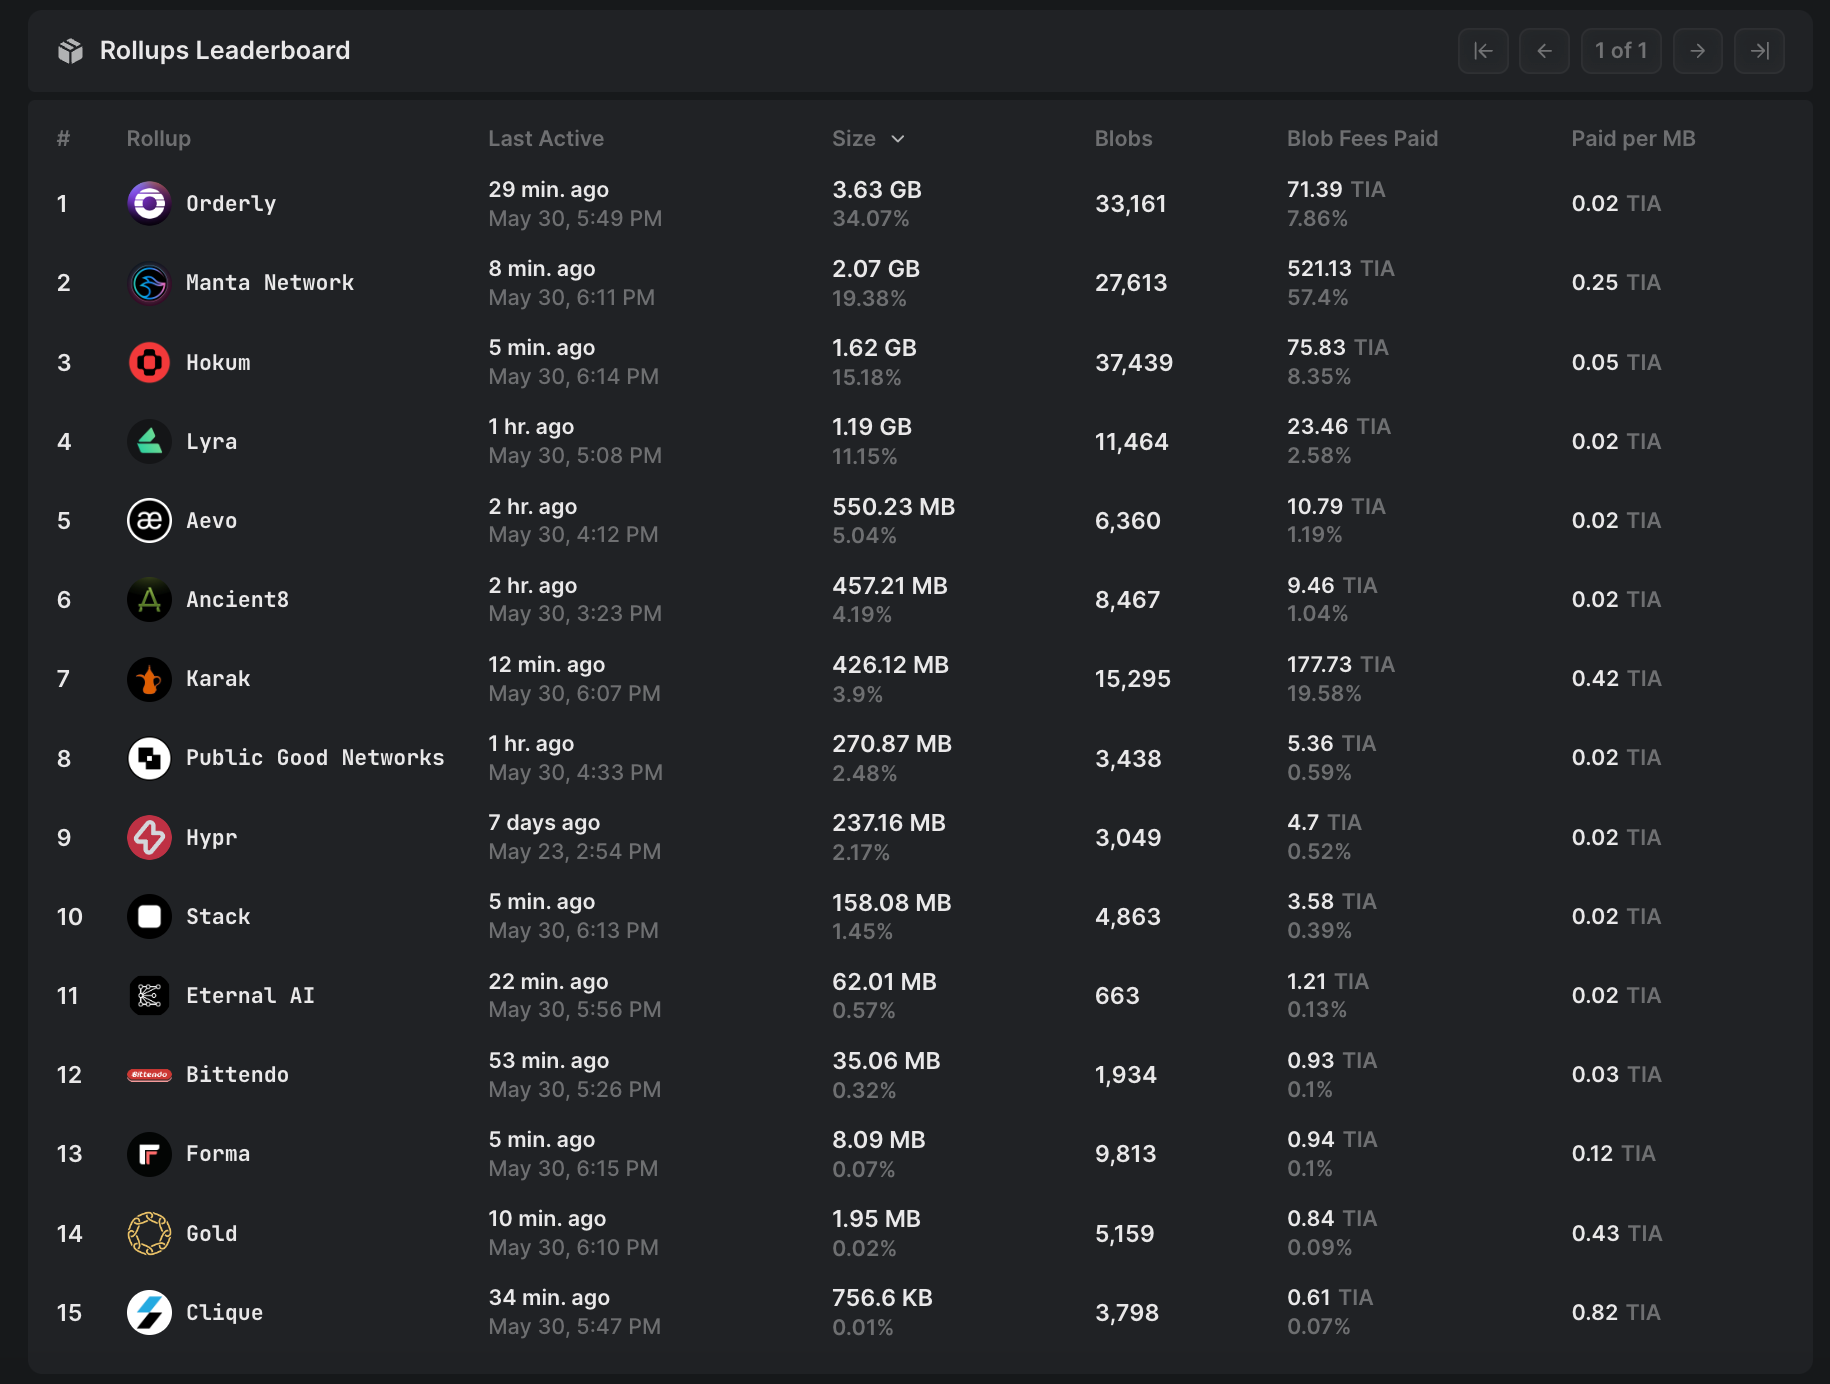
- Blobspace Markets Real-Time Dashboard: This dashboard delivers comprehensive, up-to-the-minute analytics on Celestia’s blobspace market. Users can monitor live blob submissions, track blobspace utilization, and analyze transaction trends, empowering developers and analysts to make data-driven decisions.
- Celestia Explorer (Blob Activity Module): The Blob Activity Module within Celestia Explorer offers an intuitive interface for visualizing real-time blob transactions, namespace activity, and rollup statistics. It’s an essential tool for tracking on-chain blob events and understanding network throughput.

- KYVE Data Archiving & Analytics Suite: KYVE’s suite provides robust data archiving and analytics for Celestia, ensuring historical blob data is preserved and easily accessible. Its analytics tools enable deep dives into blob activity patterns and long-term trends, supporting both real-time and retrospective analysis.

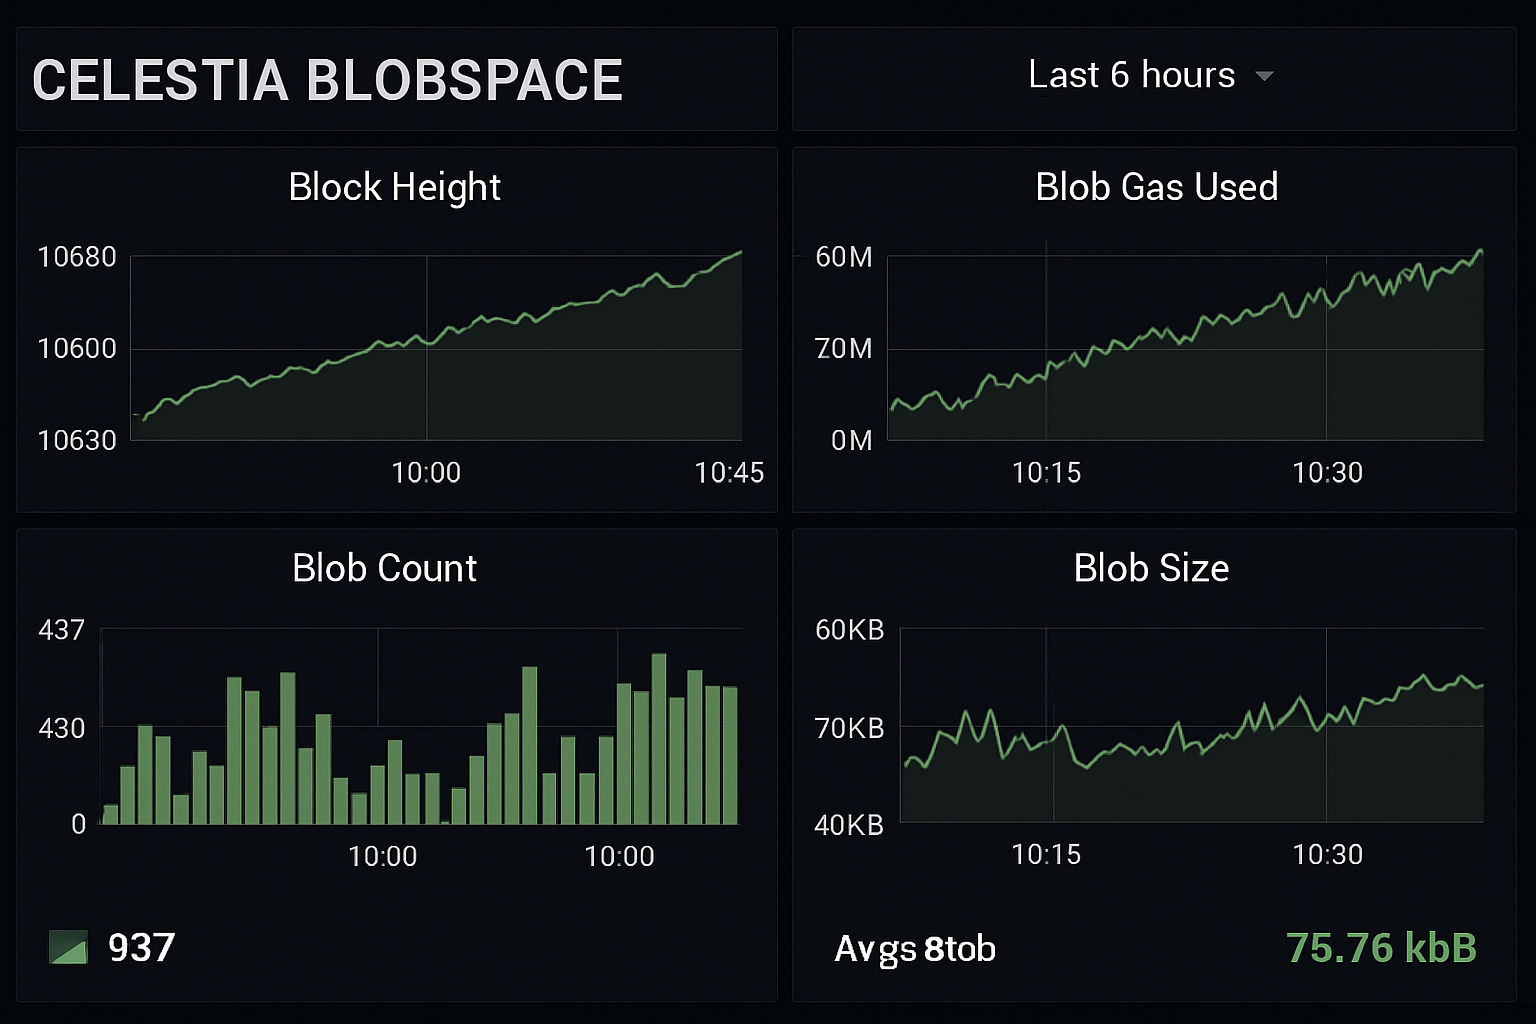
- Grafana Custom Celestia Blobspace Dashboards: Leveraging Grafana’s powerful visualization capabilities, these custom dashboards allow users to create tailored real-time monitoring solutions for Celestia blobspace. Metrics such as blob throughput, validator performance, and network health can be visualized with dynamic charts and alerts.
- Celestia-Data API by Celestia Labs: This official API provides developers with direct, programmatic access to real-time and historical blobspace data. It supports integration with custom analytics tools, enabling advanced monitoring, alerting, and automation for Celestia’s blob market.

The following tools represent the current gold standard for developers and analysts seeking granular visibility into Celestia’s blobspace:
- Blobspace Markets Real-Time Dashboard: Purpose-built for market participants, this dashboard aggregates live data on blob submissions, pricing trends, namespace allocations, and rollup-specific statistics. Its intuitive interface empowers users to dissect market microstructure in real time.
- Celestia Explorer (Blob Activity Module): This explorer module delivers transaction-level granularity on blob activity, tracking every submission, inclusion event, and associated rollup interaction. It is indispensable for researchers mapping network flows.
- KYVE Data Archiving and Analytics Suite: KYVE’s suite enables persistent storage and retrieval of historical Celestia data blobs while offering advanced analytics overlays, ideal for backtesting strategies or conducting forensic audits.
- Grafana Custom Celestia Blobspace Dashboards: By leveraging Grafana’s visualization prowess with custom plugins for Celestia metrics, users can craft bespoke dashboards tracking validator health, bridge status, hardware metrics, and more, all updated in real time.
- Celestia-Data API by Celestia Labs: This API provides direct programmatic access to raw on-chain blob data, crucial for developers building custom monitoring bots or integrating analytics into proprietary platforms.
Together these tools form a comprehensive stack that supports everything from day-to-day operational monitoring to long-term strategic research within the growing Celestia ecosystem.
Current Blob Market Dynamics: Price Action Meets On-Chain Activity
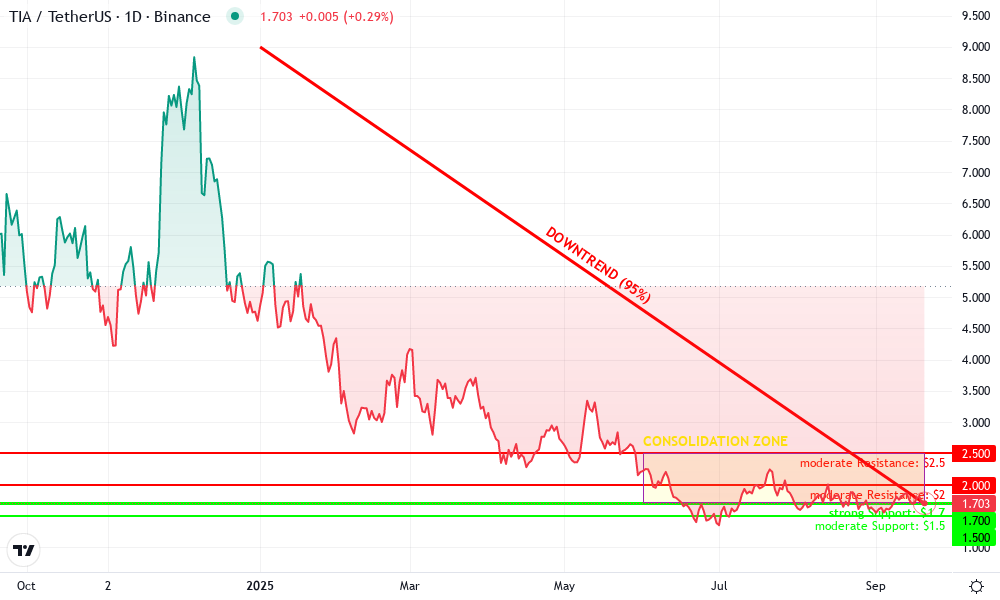
Celestia Technical Analysis Chart
Analysis by Declan Foster | Symbol: BINANCE:TIAUSDT | Interval: 1D | Drawings: 6
Technical Analysis Summary
The TIAUSDT chart shows a persistent downtrend since late 2024, followed by a multi-month period of price consolidation near the $1.70 level in mid-to-late 2025. Drawing a primary downtrend line from the January 2025 high (~$9.00) through each successive lower high to the current timeframe illustrates the prevailing bearish sentiment. Mark key horizontal support at $1.70 (current price and recent lows) and mild resistance at $2.00 and $2.50, with a major psychological resistance at $3.00. Use rectangles to highlight the broad consolidation range from June through September 2025. No signs of reversal patterns or volume spikes are evident; the chart suggests ongoing accumulation or distribution at these lower levels. Technical indicators such as MACD and volume would be helpful but are not visible in this chart image, so analysis remains price-action focused. Recommended TradingView tools: trend_line, horizontal_line, rectangle, text, callout.
Risk Assessment: high
Analysis: The persistent downtrend, lack of reversal signals, and weak market structure outweigh any fundamental optimism. Downside risk remains elevated until clear evidence of accumulation emerges.
Declan Foster's Recommendation: Continue to monitor Celestia for fundamental catalysts and technical reversal patterns. Avoid aggressive entries; only consider small, staged positions at support with strict risk controls.
Key Support & Resistance Levels
📈 Support Levels:
- $1.7 - Current price and base of multi-month consolidation; tested multiple times. strong
- $1.5 - Potential psychological and technical support below current price. moderate
📉 Resistance Levels:
- $2 - Nearest round-number resistance from recent short-lived rallies. moderate
- $2.5 - Overhead resistance from prior support before breakdown. moderate
- $3 - Major psychological resistance; significant prior support turned resistance. strong
Trading Zones (low risk tolerance)
🎯 Entry Zones:
- $1.7 - Possible accumulation at long-term support, but only for fundamentally-driven, patient investors. high risk
🚪 Exit Zones:
- $2 - First conservative profit target at initial resistance. 💰 profit target
- $1.5 - Stop-loss below established support to minimize downside risk. 🛡️ stop loss
Technical Indicators Analysis
📊 Volume Analysis:
Pattern: No volume data displayed, so unable to assess accumulation/distribution strength.
Lack of visible volume limits confirmation of price action. Await volume surge for stronger conviction.
📈 MACD Analysis:
Signal: Not visible.
MACD not available in this chart; would likely remain bearish given the persistent downtrend.
Applied TradingView Drawing Utilities
This chart analysis utilizes the following professional drawing tools:
Disclaimer: This technical analysis by Declan Foster is for educational purposes only and should not be considered as financial advice. Trading involves risk, and you should always do your own research before making investment decisions. Past performance does not guarantee future results. The analysis reflects the author's personal methodology and risk tolerance (low).
The interplay between TIA’s market price ($1.70) and underlying blob activity offers unique insights into network demand cycles. For example, periods of heightened rollup deployment often coincide with surges in both blob submissions and transaction fees, a pattern observable via advanced dashboards such as Blobspace Markets Real-Time Dashboard or Grafana instances tailored to Celestia metrics. These correlations are invaluable for traders seeking alpha as well as protocol designers tuning economic parameters.
Celestia (TIA) Price Prediction 2026-2031
Professional forecast table based on real-time analytics, adoption trends, and market signals as of September 2025.
| Year | Minimum Price | Average Price | Maximum Price | Year-over-Year Change (Avg) | Market Scenario Notes |
|---|---|---|---|---|---|
| 2026 | $1.45 | $2.05 | $3.10 | +20.6% | Gradual recovery after 2025 lows; increased adoption of modular DA and blob monitoring tools |
| 2027 | $1.70 | $2.60 | $4.20 | +26.8% | Expansion of Layer 2s using Blobstream; regulatory clarity improves sentiment |
| 2028 | $2.10 | $3.40 | $5.60 | +30.8% | Broader DeFi and rollup adoption; Celestia ecosystem matures |
| 2029 | $2.65 | $4.10 | $7.00 | +20.6% | Network effects drive usage; competition from other DA chains increases |
| 2030 | $2.90 | $4.75 | $8.40 | +15.9% | Mainstream adoption of modular blockchains; stable tokenomics and robust analytics |
| 2031 | $3.10 | $5.30 | $9.50 | +11.6% | Celestia becomes a leading DA layer; potential integration with major chains |
Price Prediction Summary
Celestia (TIA) is projected to exhibit steady growth from 2026 to 2031, fueled by technological maturity, real-time analytics adoption, and the growing need for scalable data availability solutions. While minimum prices reflect potential market downturns or increased competition, maximum prices consider bullish scenarios with widespread modular blockchain adoption. The average price projection suggests a progressive upward trend, especially as Celestia's ecosystem and monitoring tools gain traction among developers and institutions.
Key Factors Affecting Celestia Price
- Growth in demand for modular data availability solutions and rollup technology
- Adoption of real-time monitoring tools and analytics platforms
- Expansion of Celestia’s ecosystem and increased developer activity
- Potential integration of Blobstream with major Layer 2 and Ethereum projects
- Regulatory clarity and global attitudes towards DA/blockchain infrastructure
- Competition from alternative data availability and modular blockchain projects
- Market cycles, global macroeconomic conditions, and crypto market sentiment
Disclaimer: Cryptocurrency price predictions are speculative and based on current market analysis. Actual prices may vary significantly due to market volatility, regulatory changes, and other factors. Always do your own research before making investment decisions.


No comments yet. Be the first to share your thoughts!